1 Introduction
In this chapter, we will discuss the basics of R and RStudio, two essential tools in genomics data analysis. We will cover the advantages of using R and RStudio, how to set up RStudio, and the different panels of the RStudio interface.
1.1 What is R?
R is a programming language and software environment designed for statistical computing and graphics. It is widely used by statisticians, data scientists, and researchers for data analysis and visualization. R is an open-source language, which means it is free to use, modify, and distribute. Over the years, R has become particularly popular (see Figure 1.1) in the fields of genomics and bioinformatics, owing to its extensive libraries and powerful data manipulation capabilities.
The R language is a dialect of the S language, which was developed in the 1970s at Bell Laboratories. The first version of R was written by Robert Gentleman and Ross Ihaka and released in 1995 (see this slide deck for Ross Ihaka’s take on R’s history). Since then, R has been continuously developed by the R Core Team, a group of statisticians and computer scientists. The R Core Team releases a new version of R every year.
1.2 Why use R?
There are several reasons why R is a popular choice for data analysis, particularly in genomics and bioinformatics. These include:
- Open-source1: R is free to use and has a large community of developers who contribute to its growth and development. Open source software is software with source code that anyone can inspect, modify, and enhance.
- Extensive libraries: There are thousands of R packages available for a wide range of tasks, including specialized packages for genomics and bioinformatics. These libraries have been extensively tested and ara available for free.
- Data manipulation: R has powerful data manipulation capabilities, making it easy (or at least possible) to clean, process, and analyze large datasets.
- Graphics and visualization: R has excellent tools for creating high-quality graphics and visualizations that can be customized to meet the specific needs of your analysis. In most cases, graphics produced by R are publication-quality.
- Reproducible research: R enables you to create reproducible research by recording your analysis in a script, which can be easily shared and executed by others. In addition, R does not have a meaningful graphical user interface (GUI), which renders analysis in R much more reproducible than tools that rely on GUI interactions.
- Cross-platform: R runs on Windows, Mac, and Linux (as well as more obscure systems).
- Interoperability with other languages: R can interfact with FORTRAN, C, and many other languages.
- Scalability: R is useful for small and large projects. I can develop code for analysis on my Mac laptop. I can then install the same code on our 20k core cluster and run it in parallel on 100 samples, monitor the process, and then update a database (for example) with R when complete.
1 Source code is the code computer programmers can manipulate to change how a piece of software—a “program” or “application”—works. Programmers who have access to a computer program’s source code can improve that program by adding features to it or fixing parts that don’t always work correctly. For more details, see what is “open-source”?
1.3 Why not use R?
- R cannot do everything. There are some tasks that are better suited to other languages or tools. However, R can often be used to interface with these other tools.
- R is not always the “best” tool for the job. (However, it is often a “good” tool for the job.)
- R will not hold your hand. Often, it will slap your hand instead. In other words, R is not always user-friendly and can be difficult to learn. (We’ll try to make it easier for you in this book and by providing you with a good foundation for learning R and getting help when you need it.)
- The documentation can be opaque (but there is documentation).
- R can drive you crazy (on a good day) or age you prematurely (on a bad one).
- Finding the right package to do the job you want to do can be challenging; worse, some contributed packages are unreliable or poorly documented.
- R does not have a meaningfully useful graphical user interface (GUI). If you are used to working with a GUI, you may find R difficult to use at first.
Additional reasons to consider other tools include access to expertise and support from colleagues and coworkers. If you are working in a group that uses python, for example, you may want to use python for your analysis to take advantage of the expertise of your colleagues.
1.4 R License and the Open Source Ideal
R is free (yes, totally free!) and distributed under GNU license. In particular, this license allows one to:
- Download the source code
- Modify the source code to your heart’s content
- Distribute the modified source code and even charge money for it, but you must distribute the modified source code under the original GNU license.
This license means that R will always be available, will always be open source, and can grow organically without constraint.
1.5 RStudio
RStudio is an integrated development environment (IDE) for R. RStudio also provides several other useful features, including a built-in console, syntax-highlighting editor, and tools for plotting, history, debugging, workspace management, and workspace viewing. RStudio is available in both free and commercial editions; the commercial edition provides some additional features, including support for multiple sessions and enhanced debugging. For the vast majority of users, the free version is more than sufficient.
1.5.1 Getting started with RStudio
To get started with RStudio, you first need to install both R and RStudio on your computer. Follow these steps:
- Download and install R from the official R website.
- Download and install RStudio from the official RStudio website.
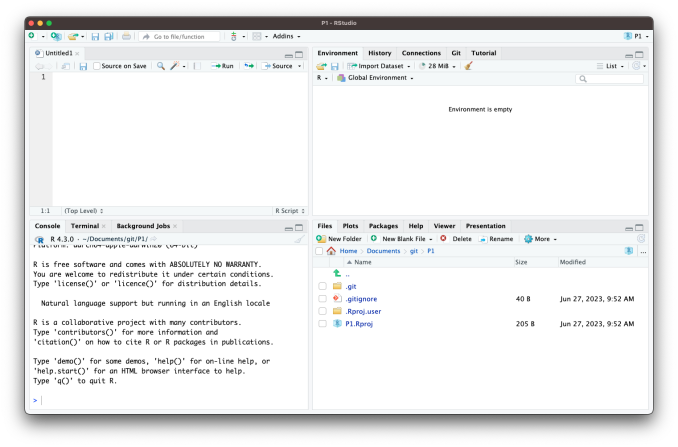
- Launch RStudio. You should see the RStudio interface with four panels as shown in Figure 1.2.
1.5.2 The RStudio Interface
RStudio’s interface consists of four panels (see Figure 1.2) that provide different functionalities:
- Console
- This panel displays the R console, where you can enter and execute R commands directly. The console also shows the output of your code, error messages, and other information.
- Source
- This panel is where you write and edit your R scripts. You can create new scripts, open existing ones, and run your code from this panel.
- Environment
- This panel displays your current workspace, including all variables, data objects, and functions that you have created or loaded in your R session.
- Plots, Packages, Help, and Viewer
- These panels display plots, installed packages, help files, and web content, respectively.
No. You can use R without RStudio. Other interfaces, such as jupyter notebooks or VScode are great alternatives. However, RStudio makes it easy to write and execute R code, and it provides several useful features that are not available in the basic R console. Note that the only part of RStudio that is actually interacting with R directly is the console. The other panels are simply providing a GUI that enhances the user experience.
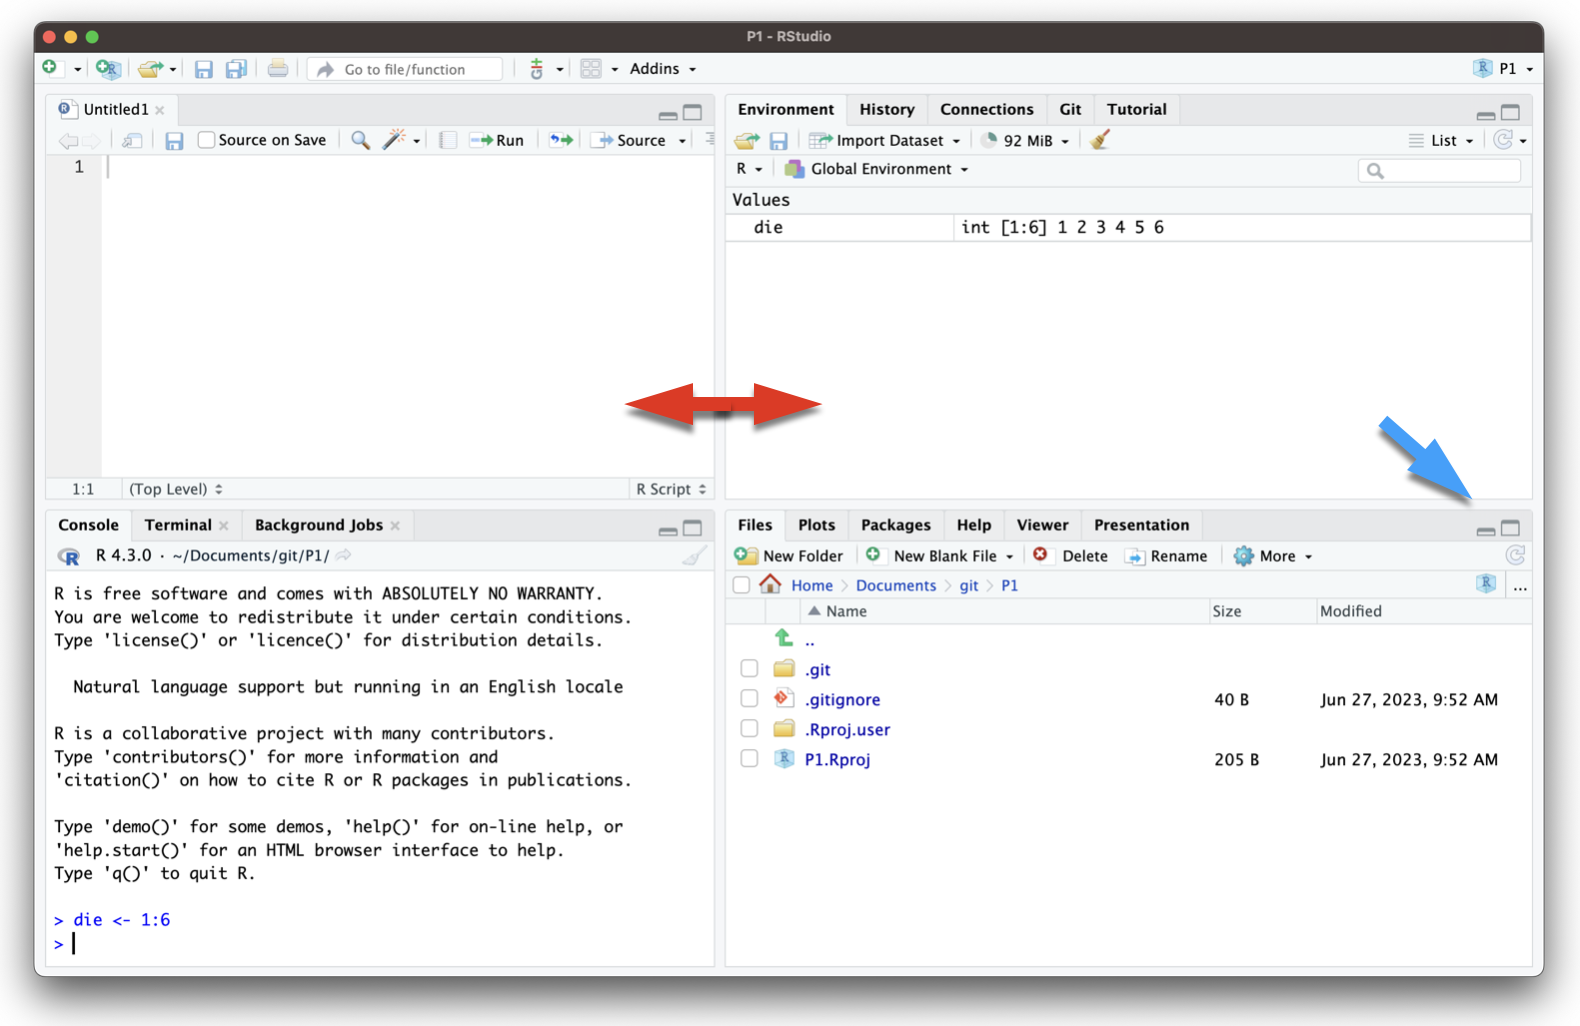
You can customize the layout of RStudio to suit your preferences. To do so, go to Tools > Global Options > Appearance. Here, you can change the theme, font size, and panel layout. You can also resize the panels as needed to gain screen real estate (see Figure 1.3).
1.6 Summary
At this point, you should have a working Rstudio installation on your computer. In the next chapter, we will discuss the basics of R programming, including how to perform simple calculations, create variables, and use functions.
1.7 Setup for the materials
In this book, we will use R and RStudio for all of our examples. I use additional packages besides those that come with R itself. To install these packages, you can use the following code. Paste this into the R console in RStudio:
# Install the necessary packages
install.packages('BiocManager')
BiocManager::install('remotes')
BiocManager::install('seandavi/2024-r-intro-bigcare')
This code will install the BiocManager package, which is used to install packages from the Bioconductor repository, and the remotes package, which is used to install packages from GitHub. We will use the seandavi/2024-r-intro-bigcare package, which contains all of the data and functions we will use in this book.