OECD International unemployment statistics
Source:R/oecd_unemployment_data.R
oecd_unemployment_data.RdThe Organisation for Economic Co-operation and Development (OECD) is an international organisation and collects and reports broadly on economic and social factors.
oecd_unemployment_data()Value
a data.frame
Details
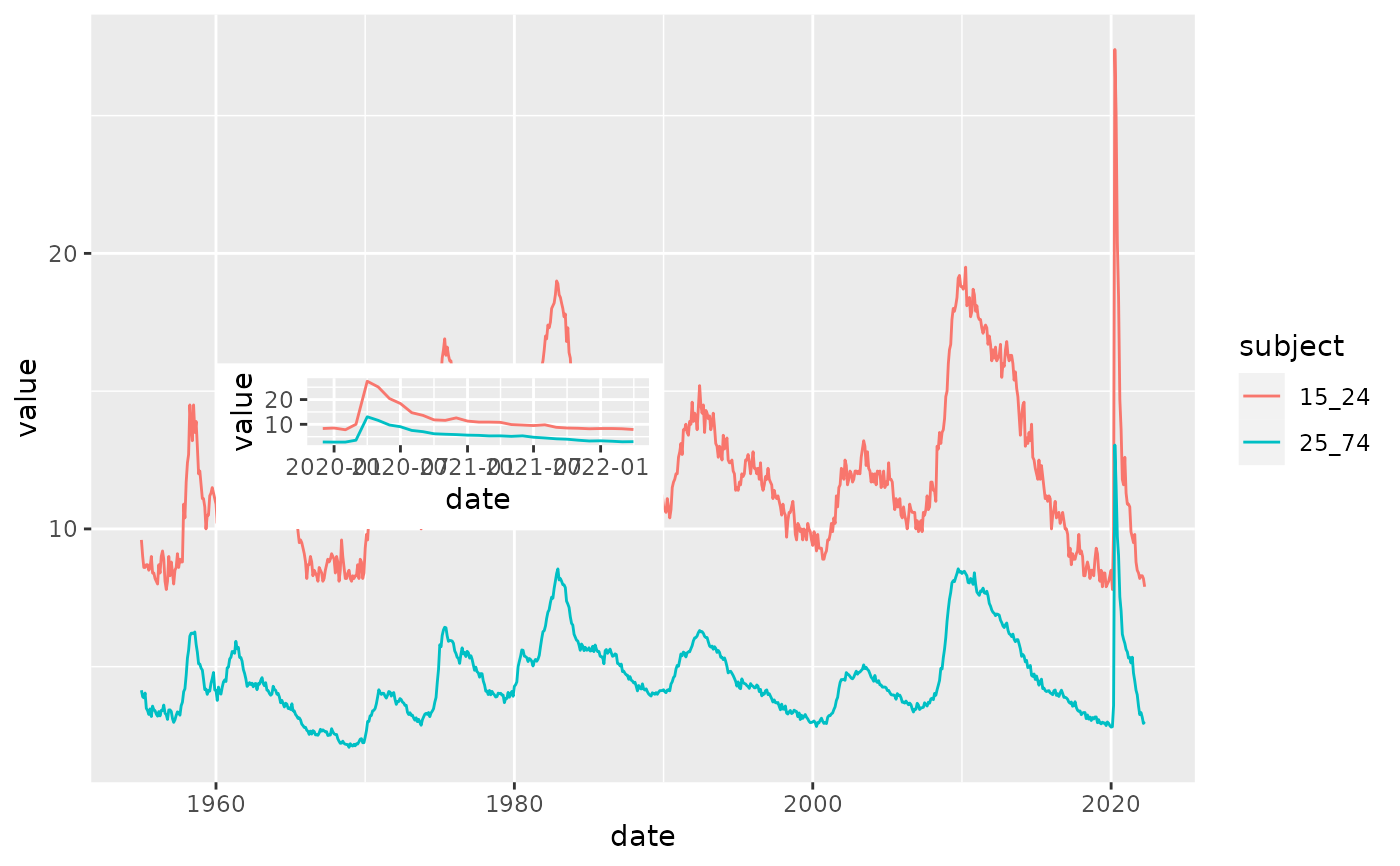
Unemployment rate is the number of unemployed people as a percentage of the labour force, where the latter consists of the unemployed plus those in paid or self-employment. Unemployed people are those who report that they are without work, that they are available for work and that they have taken active steps to find work in the last four weeks. When unemployment is high, some people become discouraged and stop looking for work; they are then excluded from the labour force. This implies that the unemployment rate may fall, or stop rising, even though there has been no underlying improvement in the labour market.
References
OECD (2020), Unemployment rate (indicator). doi: 10.1787/997c8750-en (Accessed on 05 June 2020)
See also
Other data-import:
acaps_government_measures_data(),
acaps_secondary_impact_data(),
apple_mobility_data(),
beoutbreakprepared_data(),
cci_us_vaccine_data(),
cdc_aggregated_projections(),
cdc_excess_deaths(),
cdc_social_vulnerability_index(),
coronadatascraper_data(),
coronanet_government_response_data(),
cov_glue_lineage_data(),
cov_glue_newick_data(),
cov_glue_snp_lineage(),
covidtracker_data(),
descartes_mobility_data(),
ecdc_data(),
econ_tracker_consumer_spending,
econ_tracker_employment,
econ_tracker_unemp_data,
economist_excess_deaths(),
financial_times_excess_deaths(),
google_mobility_data(),
government_policy_timeline(),
jhu_data(),
jhu_us_data(),
kff_icu_beds(),
nytimes_county_data(),
owid_data(),
param_estimates_published(),
test_and_trace_data(),
us_county_geo_details(),
us_county_health_rankings(),
us_healthcare_capacity(),
us_hospital_details(),
us_state_distancing_policy(),
usa_facts_data(),
who_cases()
Examples
unemp = oecd_unemployment_data()
unemp
#> # A tibble: 42,106 × 10
#>    iso3c indicator subject measure frequency value `flag codes` date
#>    <chr> <chr>     <chr>   <chr>   <chr>     <dbl> <chr>        <date>
#>  1 GBR   unemp     15_24   PC_LF   annual    19.6  NA           1983-01-01
#>  2 GBR   unemp     15_24   PC_LF   annual    18.7  NA           1984-01-01
#>  3 GBR   unemp     15_24   PC_LF   annual    18.0  NA           1985-01-01
#>  4 GBR   unemp     15_24   PC_LF   annual    17.7  NA           1986-01-01
#>  5 GBR   unemp     15_24   PC_LF   annual    15.1  NA           1987-01-01
#>  6 GBR   unemp     15_24   PC_LF   annual    12.2  NA           1988-01-01
#>  7 GBR   unemp     15_24   PC_LF   annual     9.95 NA           1989-01-01
#>  8 GBR   unemp     15_24   PC_LF   annual    10.4  NA           1990-01-01
#>  9 GBR   unemp     15_24   PC_LF   annual    13.9  NA           1991-01-01
#> 10 GBR   unemp     15_24   PC_LF   annual    16.4  NA           1992-01-01
#> # … with 42,096 more rows, and 2 more variables: country <chr>, region <chr>
dplyr::glimpse(unemp)
#> Rows: 42,106
#> Columns: 10
#> $ iso3c        <chr> "GBR", "GBR", "GBR", "GBR", "GBR", "GBR", "GBR", "GBR", "…
#> $ indicator    <chr> "unemp", "unemp", "unemp", "unemp", "unemp", "unemp", "un…
#> $ subject      <chr> "15_24", "15_24", "15_24", "15_24", "15_24", "15_24", "15…
#> $ measure      <chr> "PC_LF", "PC_LF", "PC_LF", "PC_LF", "PC_LF", "PC_LF", "PC…
#> $ frequency    <chr> "annual", "annual", "annual", "annual", "annual", "annual…
#> $ value        <dbl> 19.625, 18.725, 17.975, 17.725, 15.125, 12.200, 9.950, 10…
#> $ `flag codes` <chr> NA, NA, NA, NA, NA, NA, NA, NA, NA, NA, NA, NA, NA, NA, N…
#> $ date         <date> 1983-01-01, 1984-01-01, 1985-01-01, 1986-01-01, 1987-01-…
#> $ country      <chr> "United Kingdom", "United Kingdom", "United Kingdom", "Un…
#> $ region       <chr> "Europe & Central Asia", "Europe & Central Asia", "Europe…
summary(unemp)
#>     iso3c            indicator           subject            measure
#>  Length:42106       Length:42106       Length:42106       Length:42106
#>  Class :character   Class :character   Class :character   Class :character
#>  Mode  :character   Mode  :character   Mode  :character   Mode  :character
#>
#>
#>
#>   frequency             value          flag codes             date
#>  Length:42106       Min.   : 0.7931   Length:42106       Min.   :1955-01-01
#>  Class :character   1st Qu.: 5.6000   Class :character   1st Qu.:1997-02-01
#>  Mode  :character   Median : 9.0000   Mode  :character   Median :2006-08-01
#>                     Mean   :11.5753                      Mean   :2004-08-22
#>                     3rd Qu.:15.7000                      3rd Qu.:2014-05-01
#>                     Max.   :62.9000                      Max.   :2022-04-01
#>    country             region
#>  Length:42106       Length:42106
#>  Class :character   Class :character
#>  Mode  :character   Mode  :character
#>
#>
#>


library(ggplot2)
us_month_unemp = unemp %>%
    dplyr::filter(iso3c=='USA' & frequency=='month')
p1 = ggplot(us_month_unemp,aes(x=date,y=value,color=subject)) + geom_line()
p2 = dplyr::filter(us_month_unemp,date>'2019-11-01') %>%
    ggplot(aes(x=date,y=value,color=subject)) +
    geom_line() + theme(legend.position='none')

p1 + annotation_custom(ggplotGrob(p2),
                       xmin = as.Date("1960-01-01"), xmax = as.Date("1990-01-01"),
                       ymin = 10, ymax = 16)