A computable Bioconductor build report
Bioconductor spends a substantial amount of effort to build its catalog of software each day. Reporting of these results is critical for developers, users, and project leaders to understand the software “health” of the project.
The Bioconductor build reports
are generally available as html pages that are navigable with bookmarks and link out
to detailed reports of errors, etc. However, the build reports are not readily computable,
so mining the reports, automated processing by developers, and learning about
failure modes automatically is challenging. The BiocPkgTools
package is a small, utilitarian toolkit for working with Bioconductor packages
and the Bioconductor repository. Here, I wanted to present a new function for
accessing a build report as a tidy data.frame.
Install the package, if necessary.
BiocInstaller::biocLite('seandavi/BiocPkgTools')A one-liner returns the build report as a data.frame.
library(BiocPkgTools)
b_report = biocBuildReport()
library(DT)
datatable(b_report)
Using dplyr and ggplot2 gives a quick overview of the number of packages on each build system for each build “stage”.
library(ggplot2)
library(dplyr)
b_report %>%
    select(result,node,stage) %>%
    ggplot(aes(x=result)) +
    facet_grid( node ~ stage) +
    geom_bar() +
    theme(axis.text.x = element_text(angle = 45, hjust = 1)) +
    scale_y_log10()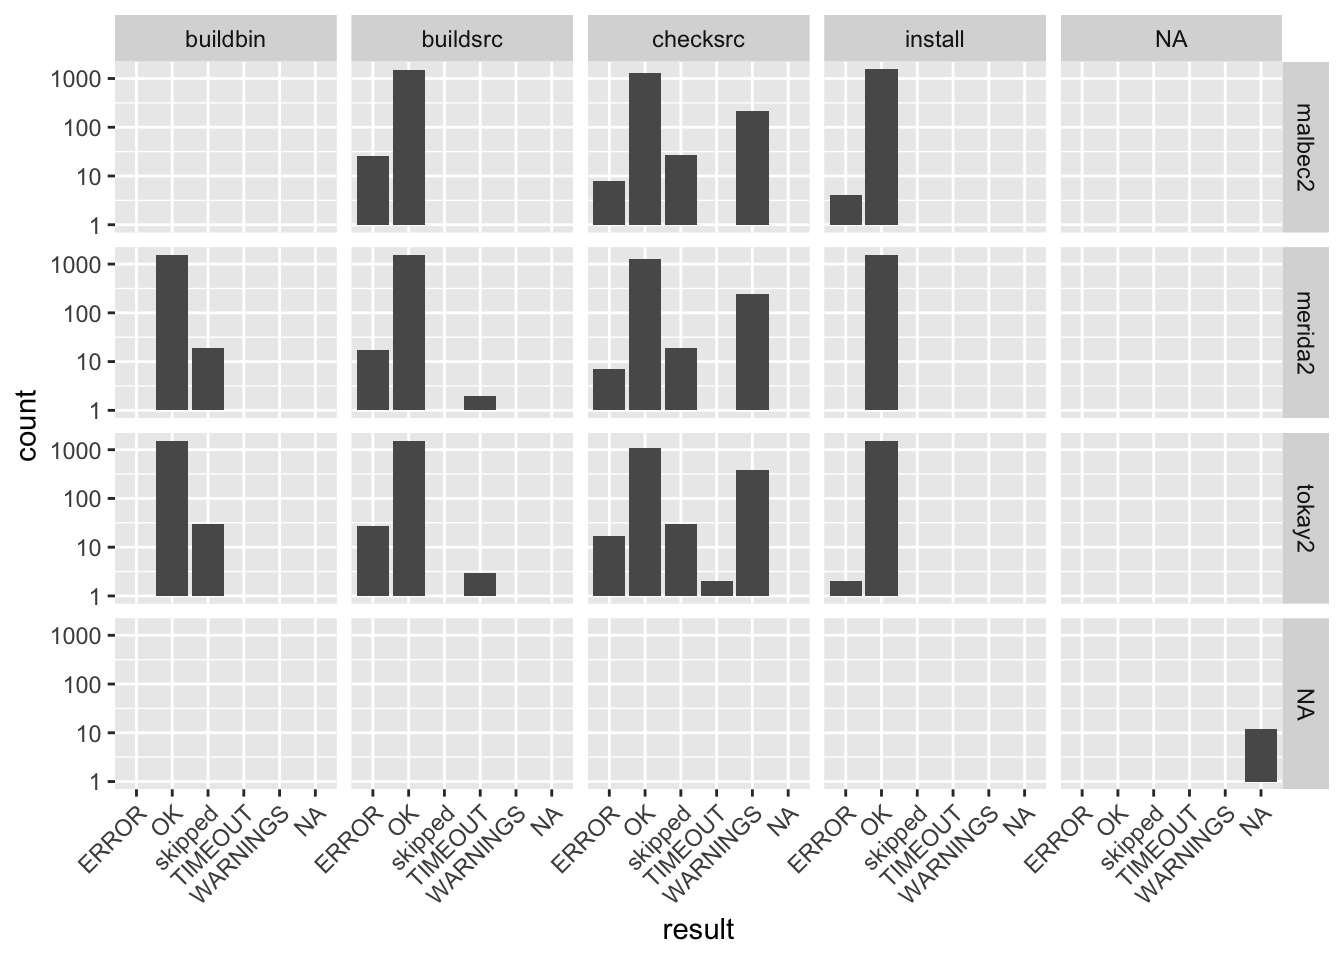
The “schema” for the data.frame is designed to be “stackable”
in tidy format to facilitate combining data from multiple build cycles
(days) for longitudinal data collection and mining. In a future post,
I may look at how to use the Bioconductor
package dependency graph to discover how “broken” packages relate
to each other to define “causative” package build problems.