Return a minimal subgraph based on package name(s)
Source:R/buildPkgDependencyGraph.R
inducedSubgraphByPkgs.RdFind the subgraph induced by including specific packages. The induced subgraph is the graph that includes the named packages and all edges connecting them. This is useful for a developer, for example, to examine her packages and their intervening dependencies.
inducedSubgraphByPkgs(g, pkgs, pkg_color = "red")Arguments
- g
an igraph graph, typically created by
buildPkgDependencyIgraph()- pkgs
character()vector of packages to include. Package names not included in the graph are ignored.- pkg_color
character(1)giving color of named packages. Other packages in the graph that fall in connecting paths will be colored as the igraph default.
Examples
library(igraph)
g <- buildPkgDependencyIgraph(buildPkgDependencyDataFrame())
#> 'getOption("repos")' replaces Bioconductor standard repositories, see
#> 'help("repositories", package = "BiocManager")' for details.
#> Replacement repositories:
#> CRAN: https://cran.rstudio.com
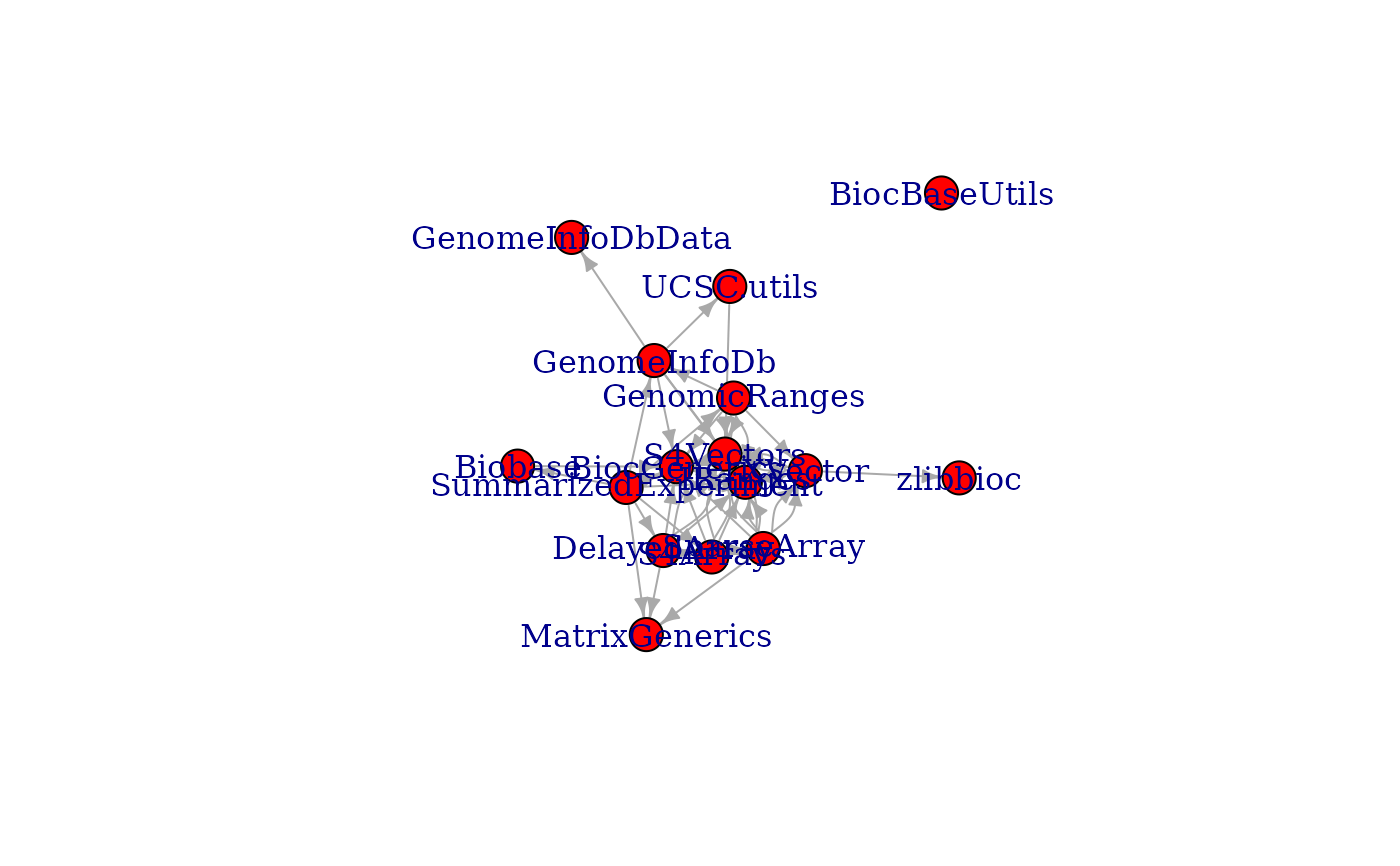
## subgraph of only the first 10 packages maintained by Bioconductor
biocmaintained <- head(biocMaintained()[["Package"]], 10L)
#> 'getOption("repos")' replaces Bioconductor standard repositories, see
#> 'help("repositories", package = "BiocManager")' for details.
#> Replacement repositories:
#> CRAN: https://cran.rstudio.com
g2 <- inducedSubgraphByPkgs(g, pkgs = biocmaintained)
g2
#> IGRAPH eebfb14 DN-- 10 11 --
#> + attr: name (v/c), color (v/c), edgetype (e/c)
#> + edges from eebfb14 (vertex names):
#> [1] annotate ->AnnotationDbi annotate ->Biobase
#> [3] AnnotationDbi ->Biobase AnnotationForge ->AnnotationDbi
#> [5] AnnotationForge ->Biobase AnnotationHub ->AnnotationDbi
#> [7] AnnotationHub ->BiocVersion AnnotationHubData->AnnotationDbi
#> [9] AnnotationHubData->AnnotationForge AnnotationHubData->AnnotationHub
#> [11] AnnotationHubData->Biobase
V(g2)
#> + 10/10 vertices, named, from eebfb14:
#> [1] annotate AnnotationDbi AnnotationForge AnnotationHub
#> [5] AnnotationHubData Biobase AnnotationFilter Bioc.gff
#> [9] BiocStyle BiocVersion
plot(g2)
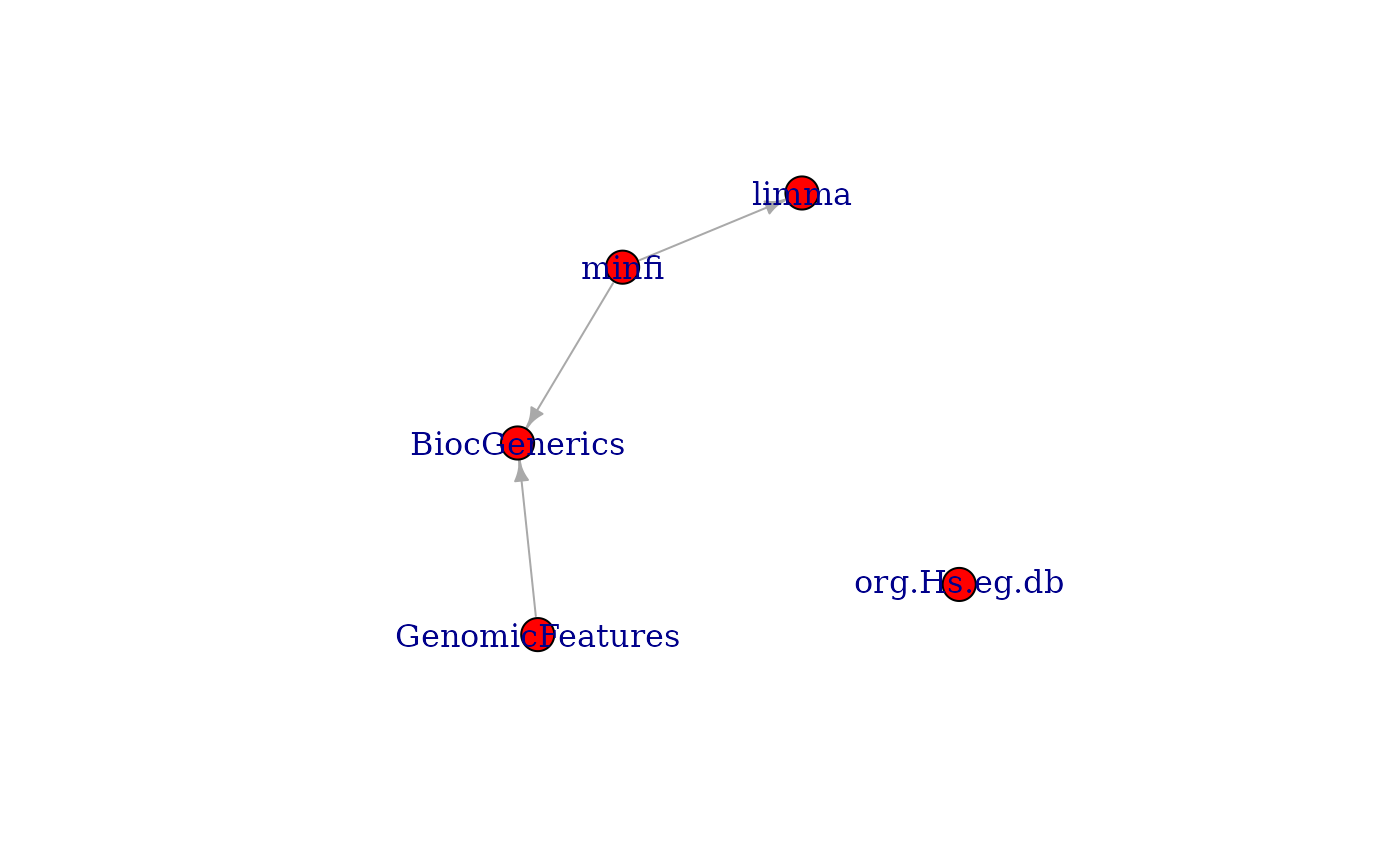 ## subgraph of a package's strong Bioconductor package dependencies
maedeps <- unlist(pkgBiocDeps(
"MultiAssayExperiment", which = "strong",
recursive = TRUE, only.bioc = TRUE
), use.names = FALSE)
#> 'getOption("repos")' replaces Bioconductor standard repositories, see
#> 'help("repositories", package = "BiocManager")' for details.
#> Replacement repositories:
#> CRAN: https://cran.rstudio.com
g3 <- inducedSubgraphByPkgs(g, pkgs = maedeps)
plot(g3)
## subgraph of a package's strong Bioconductor package dependencies
maedeps <- unlist(pkgBiocDeps(
"MultiAssayExperiment", which = "strong",
recursive = TRUE, only.bioc = TRUE
), use.names = FALSE)
#> 'getOption("repos")' replaces Bioconductor standard repositories, see
#> 'help("repositories", package = "BiocManager")' for details.
#> Replacement repositories:
#> CRAN: https://cran.rstudio.com
g3 <- inducedSubgraphByPkgs(g, pkgs = maedeps)
plot(g3)
 ## same subgraph with networkD3::forceNetwork
library(networkD3)
#>
#> Attaching package: ‘networkD3’
#> The following object is masked from ‘package:htmlwidgets’:
#>
#> JS
wt <- cluster_walktrap(g3)
members <- membership(wt)
ndg3 <- igraph_to_networkD3(g3, group = members)
forceNetwork(
Links = ndg3$links, Nodes = ndg3$nodes, Source = 'source',
Target = 'target', NodeID = 'name', Group = 'group', zoom = TRUE,
linkDistance = 200, fontSize = 20, opacity = 0.9, opacityNoHover = 0.9
)
## same subgraph with networkD3::forceNetwork
library(networkD3)
#>
#> Attaching package: ‘networkD3’
#> The following object is masked from ‘package:htmlwidgets’:
#>
#> JS
wt <- cluster_walktrap(g3)
members <- membership(wt)
ndg3 <- igraph_to_networkD3(g3, group = members)
forceNetwork(
Links = ndg3$links, Nodes = ndg3$nodes, Source = 'source',
Target = 'target', NodeID = 'name', Group = 'group', zoom = TRUE,
linkDistance = 200, fontSize = 20, opacity = 0.9, opacityNoHover = 0.9
)