BiocBuildDB Data Use Cases
Background
The BiocBuildDB package provides access to years of Bioconductor build system data, representing a comprehensive record of package builds across:
- Thousands of packages in the Bioconductor ecosystem
- Multiple R versions spanning several years of development
- Multiple platforms including Linux, macOS, and Windows
- Different build stages (install, build, check)
The Bioconductor build system runs regularly, testing all packages to ensure they meet quality standards and work correctly across different platforms. This dataset captures the results of these builds, including:
- Build status (OK, WARNING, ERROR, TIMEOUT)
- Package version information
- Git commit information
- Maintainer details
- Propagation status to the community
This vignette demonstrates how to use BiocBuildDB functions to explore and analyze this rich dataset to understand:
- Package build history and stability
- Platform-specific issues
- Package growth over time
- Common failure patterns
Setup
Accessing BiocBuildDB Data
Getting All Available Tables
The simplest way to start is to download all available data tables. The get_all_bbs_tables() function retrieves all three parquet files containing Bioconductor build data:
# Download all available tables
# This will cache the tables for quick subsequent access
get_all_bbs_tables()
The function downloads three tables:
- build_summary: Results of each build stage for every package
- info: Package metadata including version, maintainer, and git information
- propagation_status: Information about package propagation to the community
Getting Individual Tables
You can also retrieve individual tables using get_bbs_table():
# Get the build summary table
build_summary <- get_bbs_table("build_summary")

# Get the info table
info <- get_bbs_table("info")

# Get the propagation status table
propagation_status <- get_bbs_table("propagation_status")
Once downloaded, subsequent calls to these functions will use cached data, making analysis much faster.
Package-Specific Queries
Package Release Information
The get_package_release_info() function retrieves version and git information for a package across all Bioconductor releases:
# Get release information for BiocFileCache
bfc_releases <- get_package_release_info("BiocFileCache")
bfc_releases
#> # A tibble: 11 × 5
#>    Package       Version git_branch   git_last_commit git_last_commit_date
#>    <chr>         <chr>   <chr>        <chr>           <dttm>
#>  1 BiocFileCache 2.0.0   RELEASE_3_13 280a8f9         2021-05-19 16:26:36
#>  2 BiocFileCache 2.2.1   RELEASE_3_14 cc91212         2022-01-20 13:21:33
#>  3 BiocFileCache 2.4.0   RELEASE_3_15 2c00eee         2022-04-26 15:39:42
#>  4 BiocFileCache 2.6.1   RELEASE_3_16 fdeb0ad         2023-02-17 11:39:09
#>  5 BiocFileCache 2.8.0   RELEASE_3_17 d088b32         2023-04-25 14:53:05
#>  6 BiocFileCache 2.10.2  RELEASE_3_18 c95edcc         2024-03-27 16:42:13
#>  7 BiocFileCache 2.12.0  RELEASE_3_19 a655653         2024-04-30 14:56:59
#>  8 BiocFileCache 2.14.0  RELEASE_3_20 66862c5         2024-10-29 15:18:07
#>  9 BiocFileCache 2.16.2  RELEASE_3_21 22fec96         2025-08-25 12:44:02
#> 10 BiocFileCache 3.0.0   RELEASE_3_22 81fd6e0         2025-10-29 15:37:29
#> 11 BiocFileCache 3.1.0   devel        c4f8ba6         2025-10-29 15:37:29
This shows:
- Package versions across different Bioconductor releases
- Git branches (devel, RELEASE_3_22, etc.)
- Git commit hashes
- Last commit dates
This is useful for tracking when a package was updated in different Bioconductor releases.
Package Error Counts
The package_error_count() function provides statistics on how often a package has failed during builds:
# Get error counts for BiocFileCache
bfc_errors <- package_error_count("BiocFileCache")
bfc_errors
#> # A tibble: 408 × 6
#>    node      version    stage    count_total count_error git_branch
#>    <chr>     <pckg_vrs> <chr>          <int>       <int> <chr>
#>  1 machv2    2.0.0      buildbin           1           0 RELEASE_3_13
#>  2 machv2    2.0.0      buildsrc           1           0 RELEASE_3_13
#>  3 machv2    2.0.0      checksrc           1           0 RELEASE_3_13
#>  4 machv2    2.0.0      install            1           0 RELEASE_3_13
#>  5 nebbiolo1 2.0.0      buildsrc           1           0 RELEASE_3_13
#>  6 nebbiolo1 2.0.0      checksrc           1           0 RELEASE_3_13
#>  7 nebbiolo1 2.0.0      install            1           0 RELEASE_3_13
#>  8 tokay2    2.0.0      buildbin           1           0 RELEASE_3_13
#>  9 tokay2    2.0.0      buildsrc           1           0 RELEASE_3_13
#> 10 tokay2    2.0.0      checksrc           1           0 RELEASE_3_13
#> # ℹ 398 more rows

# Filter to a specific branch
bfc_errors_release <- package_error_count("BiocFileCache", branch = "RELEASE_3_22")
bfc_errors_release
#> # A tibble: 22 × 6
#>    node      version    stage    count_total count_error git_branch
#>    <chr>     <pckg_vrs> <chr>          <int>       <int> <chr>
#>  1 kjohnson1 3.0.0      buildbin           6           0 RELEASE_3_22
#>  2 kjohnson1 3.0.0      buildsrc           8           2 RELEASE_3_22
#>  3 kjohnson1 3.0.0      checksrc           6           2 RELEASE_3_22
#>  4 kjohnson1 3.0.0      install            8           0 RELEASE_3_22
#>  5 kjohnson3 3.0.0      buildbin           8           0 RELEASE_3_22
#>  6 kjohnson3 3.0.0      buildsrc          10           2 RELEASE_3_22
#>  7 kjohnson3 3.0.0      checksrc           8           0 RELEASE_3_22
#>  8 kjohnson3 3.0.0      install           10           0 RELEASE_3_22
#>  9 lconway   3.0.0      buildbin           4           0 RELEASE_3_22
#> 10 lconway   3.0.0      buildsrc           5           1 RELEASE_3_22
#> # ℹ 12 more rows

# Filter to a specific builder
bfc_errors_builder <- package_error_count("BiocFileCache",
                                          builder = "nebbiolo2",
                                          branch = "RELEASE_3_22")
bfc_errors_builder
#> # A tibble: 3 × 6
#>   node      version    stage    count_total count_error git_branch
#>   <chr>     <pckg_vrs> <chr>          <int>       <int> <chr>
#> 1 nebbiolo2 3.0.0      buildsrc          39           8 RELEASE_3_22
#> 2 nebbiolo2 3.0.0      checksrc          31           7 RELEASE_3_22
#> 3 nebbiolo2 3.0.0      install           39           0 RELEASE_3_22
This returns:
- Node (builder machine name)
- Package version
- Build stage (install, build, check)
- Total number of runs
- Total number of errors
- Git branch
For the devel branch, you can filter to the most recent version:
# Get devel errors
dev_errors <- package_error_count("BiocFileCache", branch = "devel")

# Filter to current devel version
dev_errors |> filter(version == max(version))
#> # A tibble: 11 × 6
#>    node      version    stage    count_total count_error git_branch
#>    <chr>     <pckg_vrs> <chr>          <int>       <int> <chr>
#>  1 kjohnson3 3.1.0      buildbin          46           0 devel
#>  2 kjohnson3 3.1.0      buildsrc          57          11 devel
#>  3 kjohnson3 3.1.0      checksrc          46           0 devel
#>  4 kjohnson3 3.1.0      install           57           0 devel
#>  5 lconway   3.1.0      buildbin           9           0 devel
#>  6 lconway   3.1.0      buildsrc          11           2 devel
#>  7 lconway   3.1.0      checksrc           9           1 devel
#>  8 lconway   3.1.0      install           11           0 devel
#>  9 nebbiolo1 3.1.0      buildsrc          85          14 devel
#> 10 nebbiolo1 3.1.0      checksrc          71           8 devel
#> 11 nebbiolo1 3.1.0      install           85           0 devel
Exploratory Data Analysis
Package Growth Over Time
Let’s explore how the number of Bioconductor packages has grown over time:
# Get info table
info <- get_bbs_table("info")

# Count unique packages by branch
package_counts <- info |>
  group_by(git_branch) |>
  summarise(
    n_packages = n_distinct(Package),
    .groups = "drop"
  ) |>
  arrange(desc(n_packages))

# Display the counts
package_counts
#> # A tibble: 12 × 2
#>    git_branch   n_packages
#>    <chr>             <int>
#>  1 devel              3052
#>  2 RELEASE_3_22       2885
#>  3 RELEASE_3_21       2859
#>  4 RELEASE_3_19       2816
#>  5 RELEASE_3_20       2807
#>  6 RELEASE_3_18       2778
#>  7 RELEASE_3_17       2723
#>  8 RELEASE_3_16       2670
#>  9 RELEASE_3_15       2622
#> 10 RELEASE_3_14       2528
#> 11 RELEASE_3_13       2475
#> 12 master               33

# Visualize package counts by branch
ggplot(package_counts, aes(x = reorder(git_branch, n_packages), y = n_packages)) +
  geom_col(fill = "steelblue") +
  coord_flip() +
  labs(
    title = "Number of Packages by Bioconductor Branch",
    x = "Branch",
    y = "Number of Packages"
  ) +
  theme_minimal()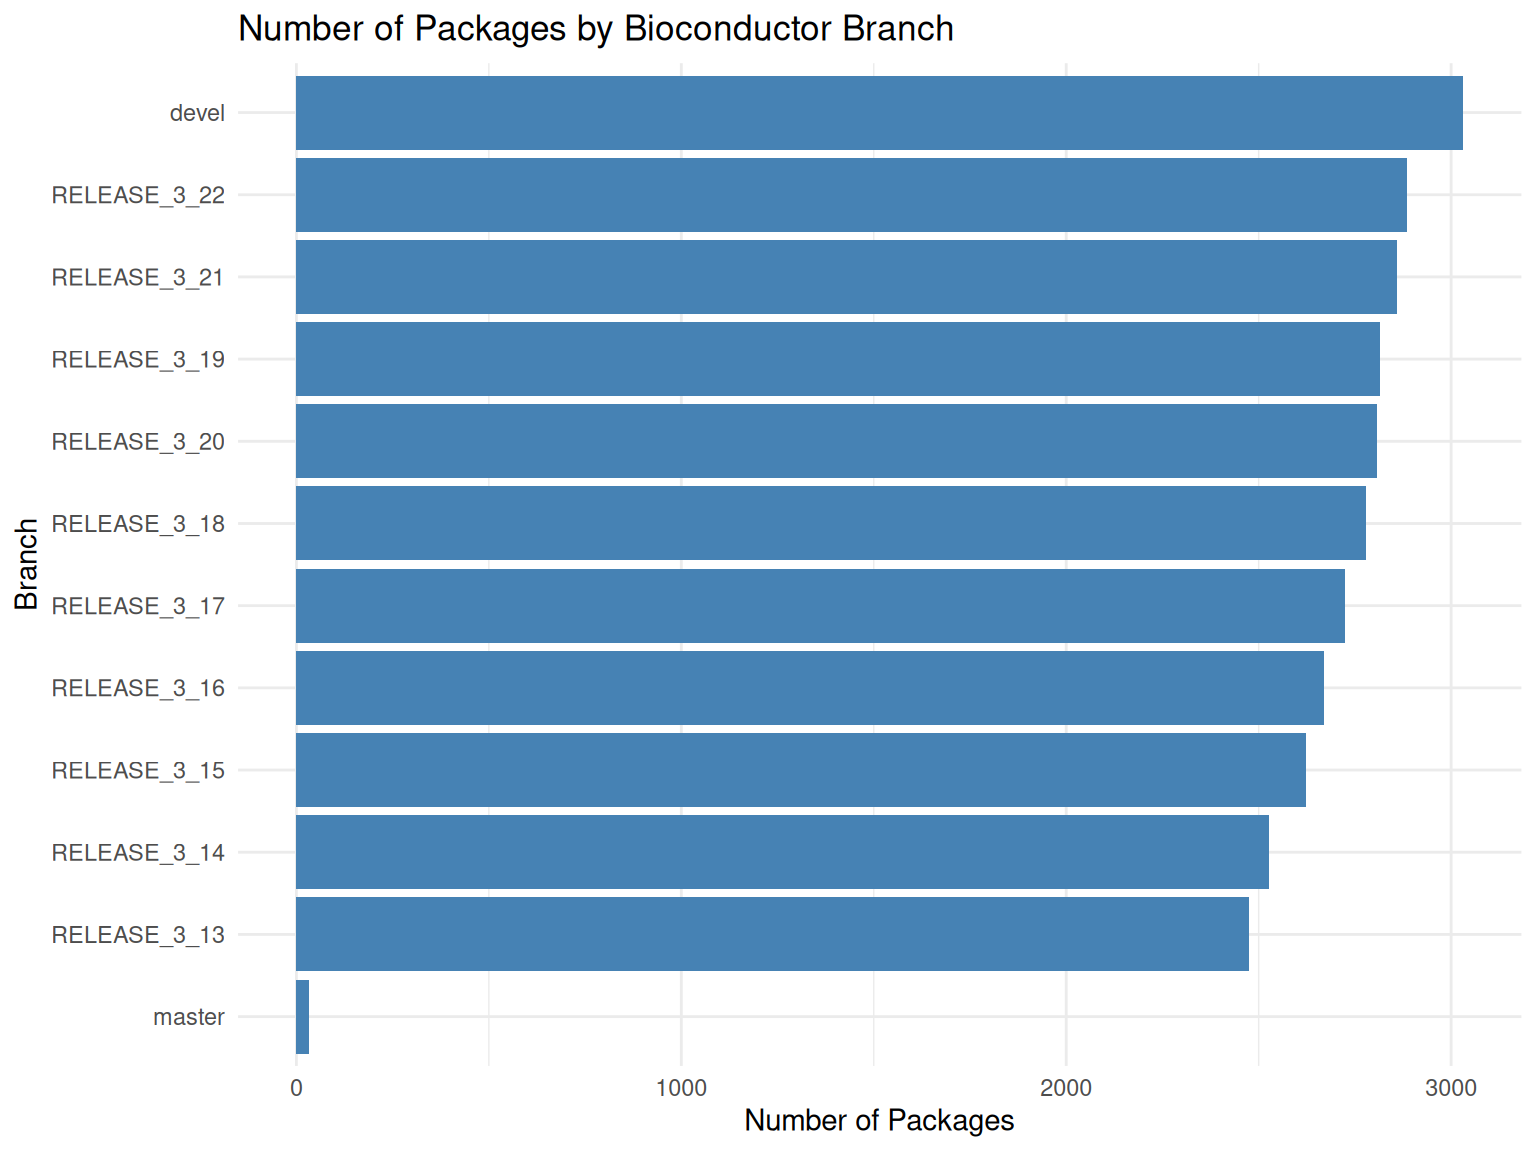
Build Status Distribution
Understanding the distribution of build statuses helps identify overall system health:
# Get build summary table
build_summary <- get_bbs_table("build_summary")

# Count build statuses
status_counts <- build_summary |>
  count(status) |>
  arrange(desc(n))

status_counts
#> # A tibble: 4 × 2
#>   status          n
#>   <chr>       <int>
#> 1 OK       12716622
#> 2 WARNINGS   621853
#> 3 ERROR      388476
#> 4 TIMEOUT     17582

# Visualize status distribution
ggplot(status_counts, aes(x = reorder(status, n), y = n)) +
  geom_col(aes(fill = status)) +
  scale_fill_manual(values = c(
    "OK" = "green3",
    "WARNING" = "orange",
    "ERROR" = "red",
    "TIMEOUT" = "darkred"
  )) +
  coord_flip() +
  labs(
    title = "Distribution of Build Statuses",
    x = "Status",
    y = "Count"
  ) +
  theme_minimal() +
  theme(legend.position = "none")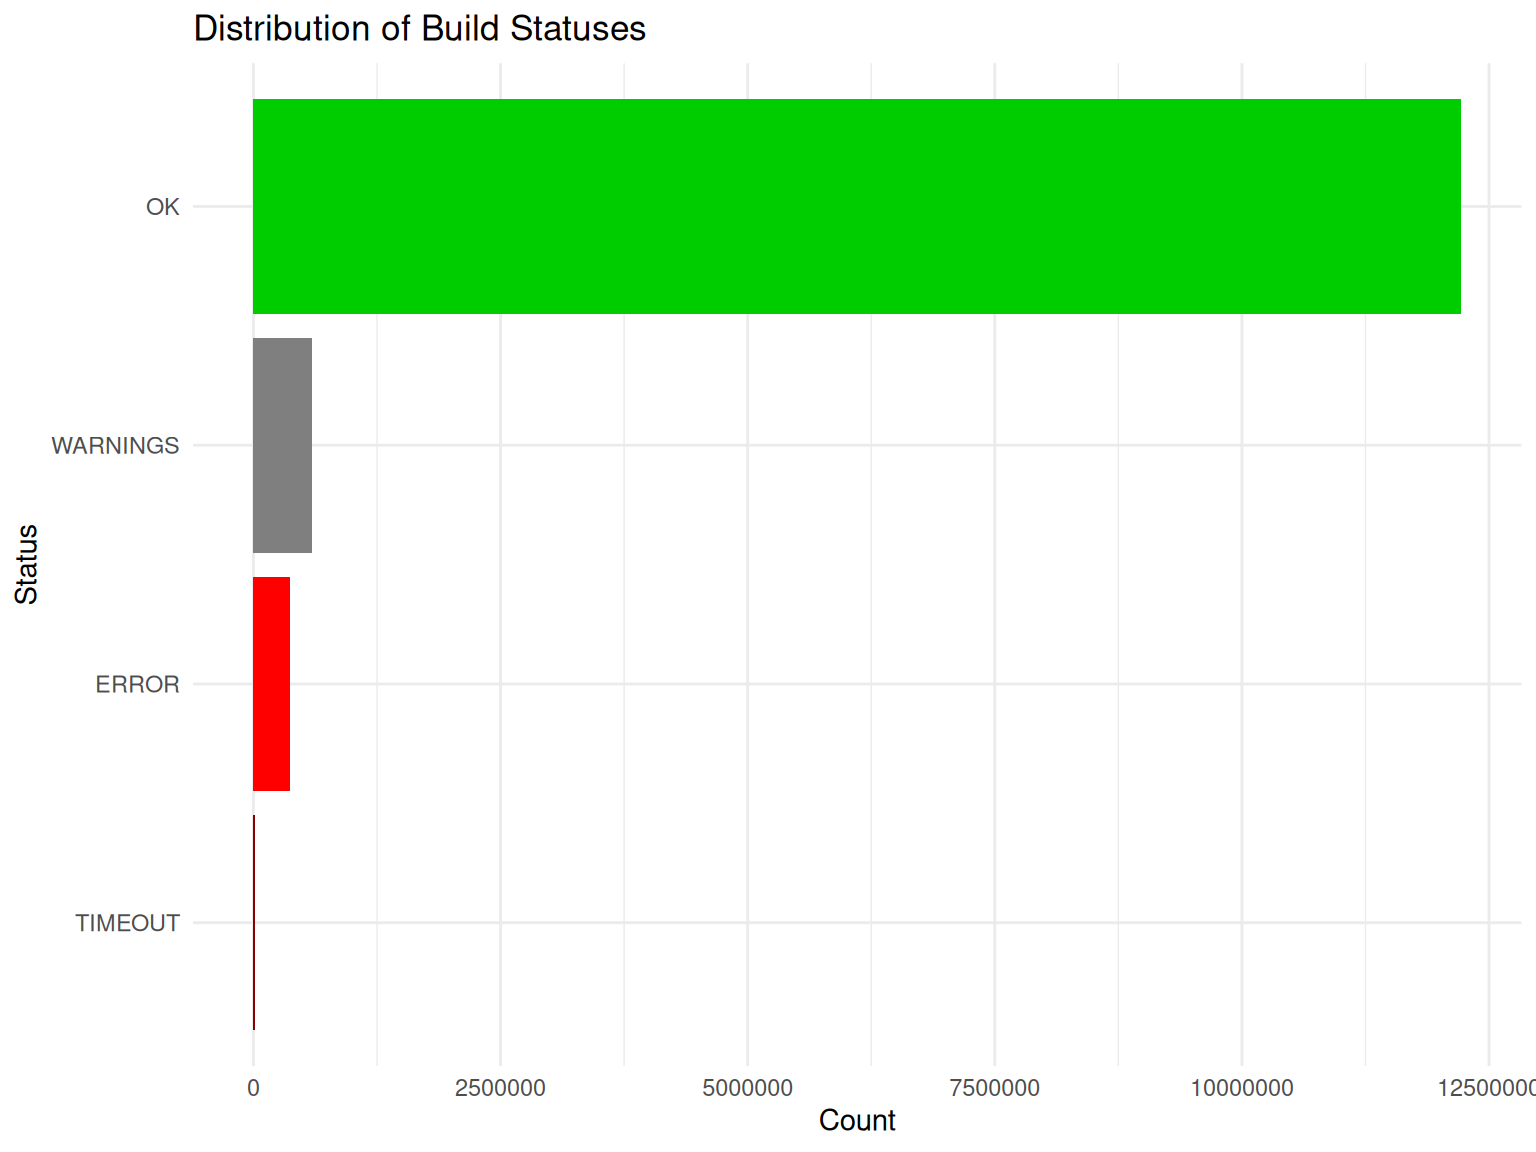
Platform-Specific Analysis
Different platforms may have different build characteristics:
# Analyze build status by platform (node)
platform_status <- build_summary |>
  group_by(node, status) |>
  summarise(count = n(), .groups = "drop") |>
  group_by(node) |>
  mutate(
    total = sum(count),
    percentage = count / total * 100
  ) |>
  ungroup()

# Show error rates by platform
error_rates <- platform_status |>
  filter(status %in% c("ERROR", "TIMEOUT")) |>
  group_by(node) |>
  summarise(
    error_count = sum(count),
    total = first(total),
    error_rate = sum(percentage),
    .groups = "drop"
  ) |>
  arrange(desc(error_rate))

head(error_rates, 10)
#> # A tibble: 10 × 4
#>    node      error_count   total error_rate
#>    <chr>           <int>   <int>      <dbl>
#>  1 kakapo1           114     740      15.4
#>  2 riesling1          12      88      13.6
#>  3 amarone           196    1466      13.4
#>  4 biocgpu           265    2328      11.4
#>  5 taishan         55374  944243       5.86
#>  6 kunpeng2        50358  907145       5.55
#>  7 nebbiolo1       58379 1934925       3.02
#>  8 kjohnson3       69678 2342492       2.97
#>  9 kjohnson2         251    8628       2.91
#> 10 palomino3       11216  436957       2.57
Build Stage Analysis
Understanding which build stage most often fails:
# Analyze failures by stage
stage_failures <- build_summary |>
  filter(status %in% c("ERROR", "TIMEOUT")) |>
  count(stage, status) |>
  arrange(desc(n))

stage_failures
#> # A tibble: 8 × 3
#>   stage    status       n
#>   <chr>    <chr>    <int>
#> 1 buildsrc ERROR   204920
#> 2 checksrc ERROR   111973
#> 3 install  ERROR    70717
#> 4 checksrc TIMEOUT   9444
#> 5 buildsrc TIMEOUT   8049
#> 6 buildbin ERROR      866
#> 7 buildbin TIMEOUT     57
#> 8 install  TIMEOUT     32

# Visualize
ggplot(stage_failures, aes(x = stage, y = n, fill = status)) +
  geom_col() +
  scale_fill_manual(values = c("ERROR" = "red", "TIMEOUT" = "darkred")) +
  labs(
    title = "Build Failures by Stage",
    x = "Build Stage",
    y = "Number of Failures",
    fill = "Status"
  ) +
  theme_minimal()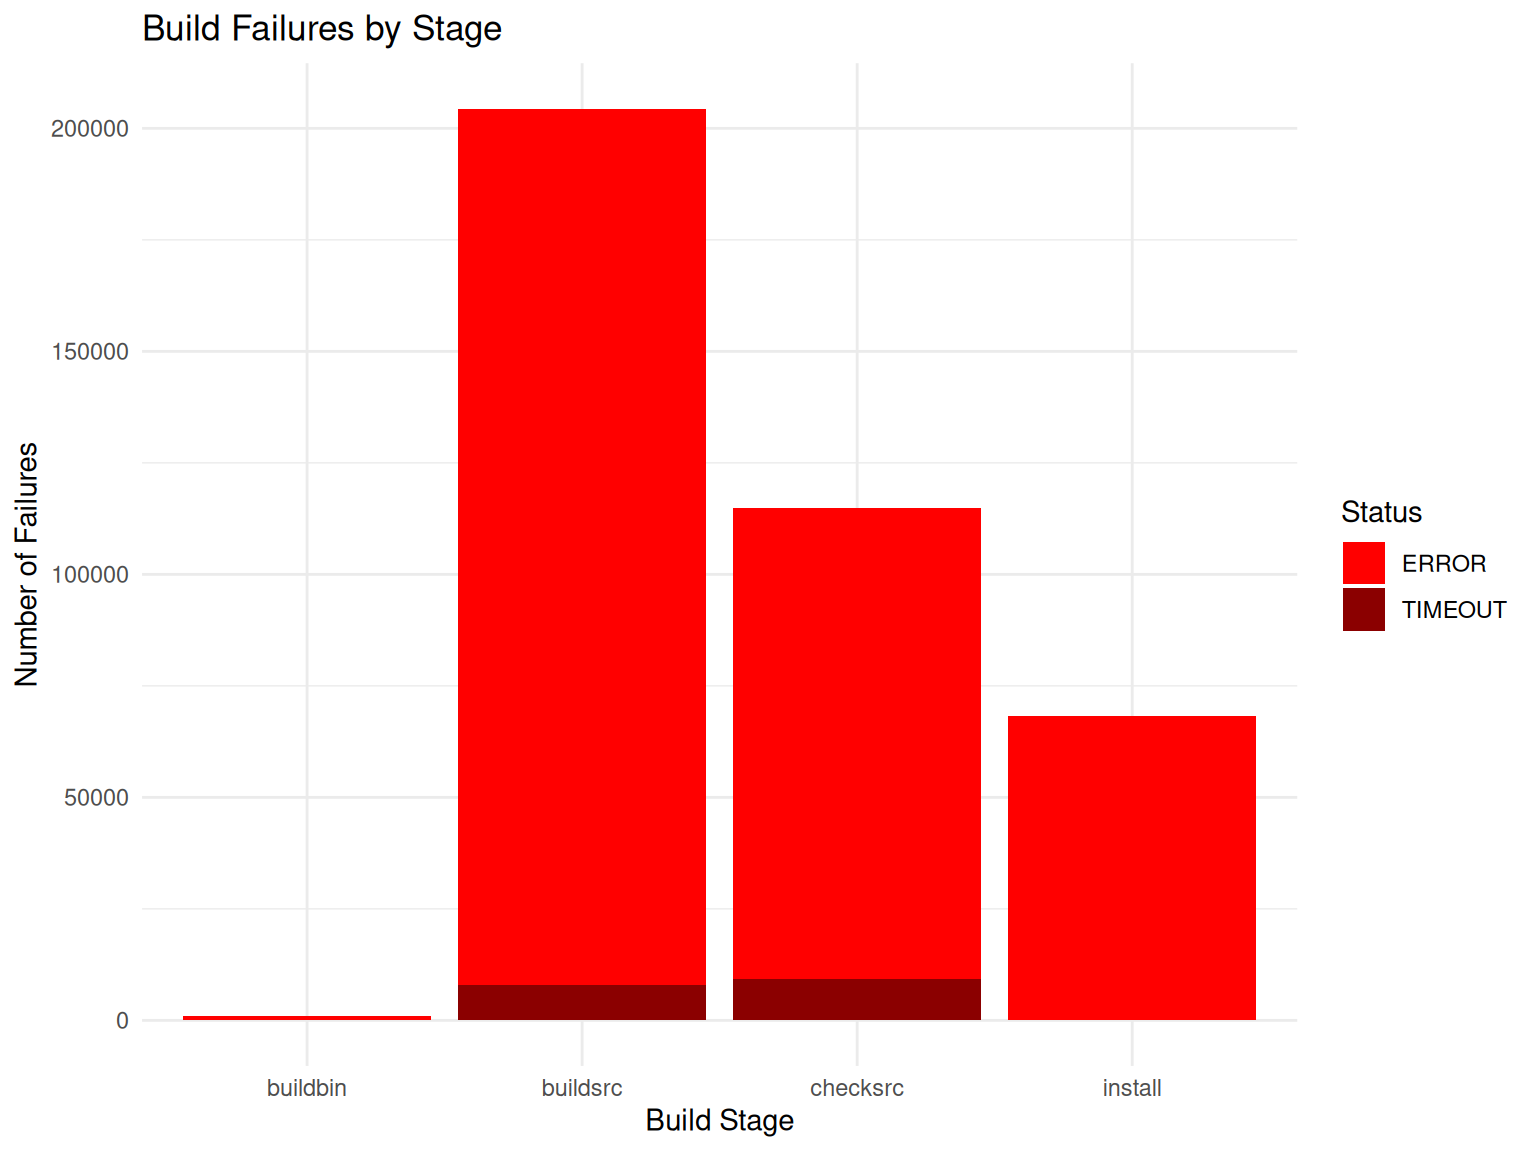
Most Problematic Packages
Identify packages with the highest error rates:
# Find packages with most errors
package_errors <- build_summary |>
  filter(status %in% c("ERROR", "TIMEOUT")) |>
  count(package, status) |>
  group_by(package) |>
  summarise(
    total_errors = sum(n),
    .groups = "drop"
  ) |>
  arrange(desc(total_errors))

# Top 10 packages with most errors
head(package_errors, 10)
#> # A tibble: 10 × 2
#>    package    total_errors
#>    <chr>             <int>
#>  1 lapmix             2172
#>  2 netZooR            1727
#>  3 hypeR              1685
#>  4 ChemmineOB         1554
#>  5 XNAString          1484
#>  6 Repitools          1472
#>  7 ccfindR            1456
#>  8 gpuMagic           1426
#>  9 graper             1388
#> 10 gespeR             1375
Maintainer Analysis
Analyze package maintenance patterns:
# Get unique packages per maintainer
maintainer_packages <- info |>
  group_by(Maintainer) |>
  summarise(
    n_packages = n_distinct(Package),
    packages = paste(unique(Package), collapse = ", "),
    .groups = "drop"
  ) |>
  arrange(desc(n_packages))

# Top maintainers by number of packages
head(maintainer_packages, 10)
#> # A tibble: 10 × 3
#>    Maintainer                      n_packages packages
#>    <chr>                                <int> <chr>
#>  1 Bioconductor Package Maintainer         72 GSE62944, hgu2beta7, TENxBrainDat…
#>  2 Aaron Lun                               62 celldex, chipseqDBData, DropletTe…
#>  3 Hervé Pagès                             25 pasillaBamSubset, RNAseqData.HNRN…
#>  4 VJ Carey                                25 harbChIP, leeBamViews, MAQCsubset…
#>  5 Laurent Gatto                           24 depmap, RforProteomics, CTdata, h…
#>  6 Marcel Ramos                            24 curatedTCGAData, SingleCellMultiM…
#>  7 Michael Love                            20 airway, fission, macrophage, null…
#>  8 Guangchuang Yu                          16 ChIPseeker, clusterProfiler, DOSE…
#>  9 Jianhong Ou                             16 ATACseqQC, ATACseqTFEA, ChIPpeakA…
#> 10 Mike Smith                              16 BeadArrayUseCases, HD2013SGI, min…

# Distribution of packages per maintainer
ggplot(maintainer_packages, aes(x = n_packages)) +
  geom_histogram(binwidth = 1, fill = "steelblue", color = "white") +
  labs(
    title = "Distribution of Packages per Maintainer",
    x = "Number of Packages",
    y = "Number of Maintainers"
  ) +
  theme_minimal()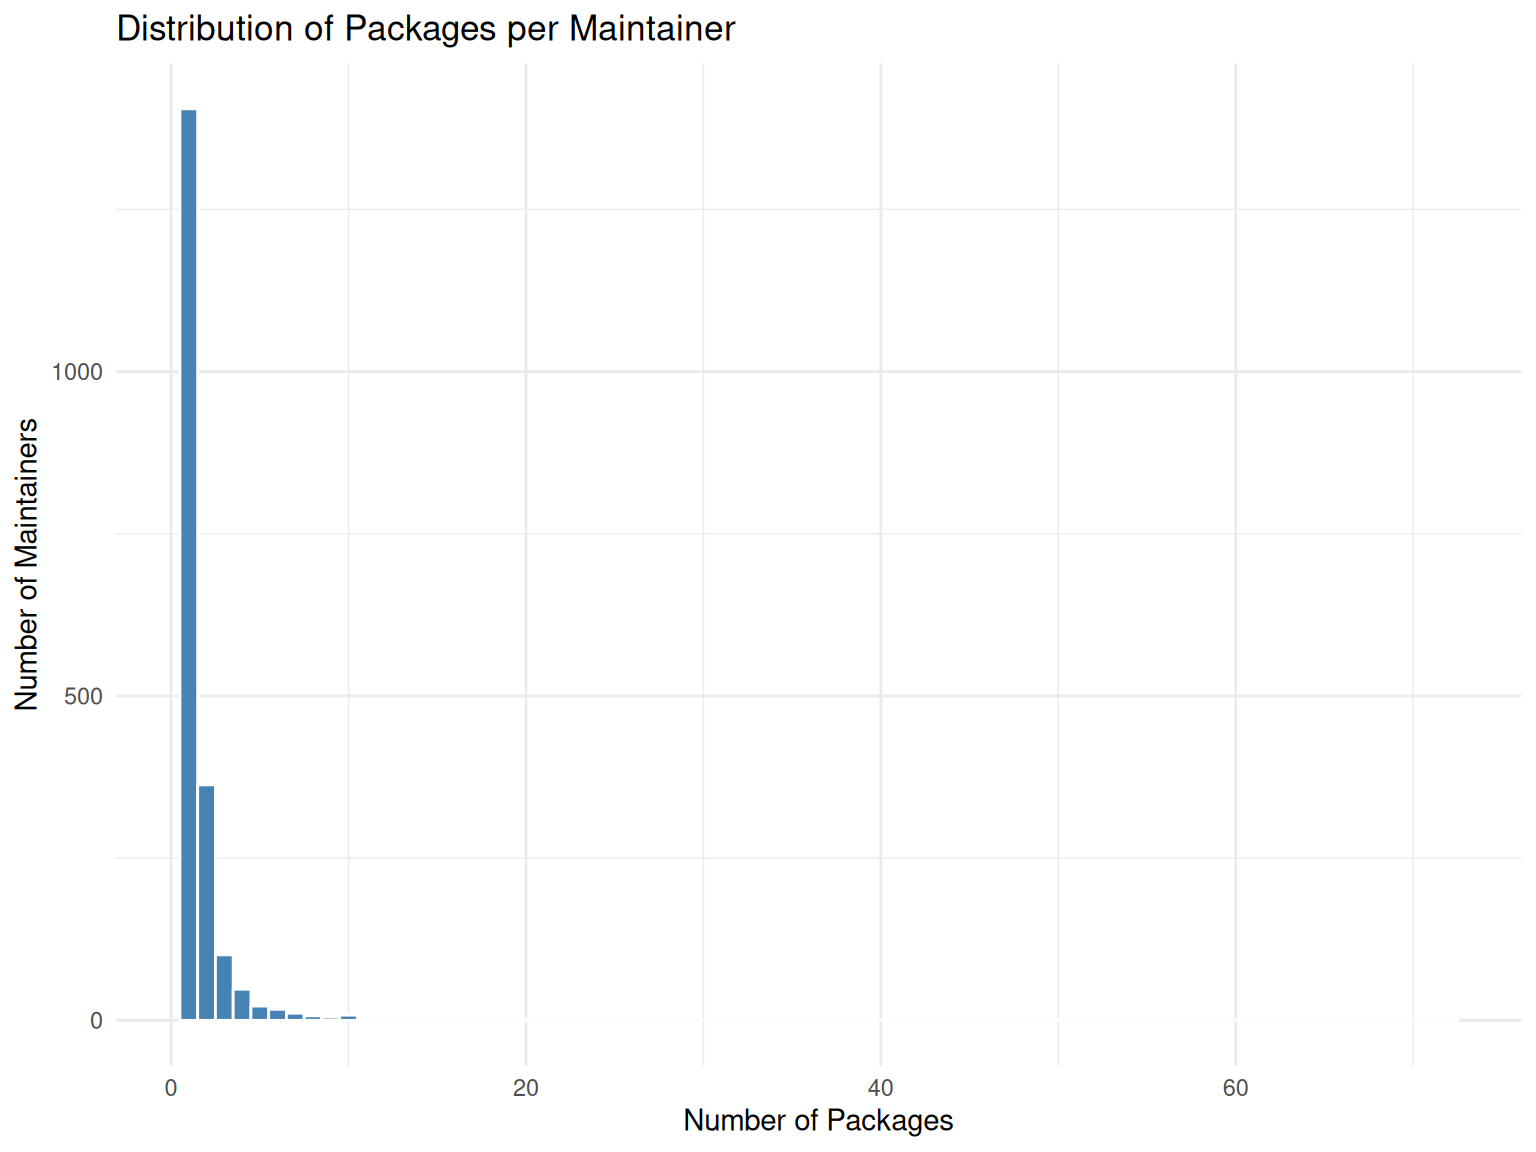
Temporal Analysis
Analyze build patterns over time:
# Analyze build patterns over time
build_summary <- build_summary |>
  mutate(
    date = as.Date(startedat),
    month = format(startedat, "%Y-%m")
  )

# Build activity by month
monthly_builds <- build_summary |>
  count(month) |>
  mutate(month_date = as.Date(paste0(month, "-01")))

ggplot(monthly_builds, aes(x = month_date, y = n)) +
  geom_line(color = "steelblue", linewidth = 1) +
  geom_point(color = "steelblue") +
  labs(
    title = "Build Activity Over Time",
    x = "Month",
    y = "Number of Builds"
  ) +
  theme_minimal() +
  theme(axis.text.x = element_text(angle = 45, hjust = 1))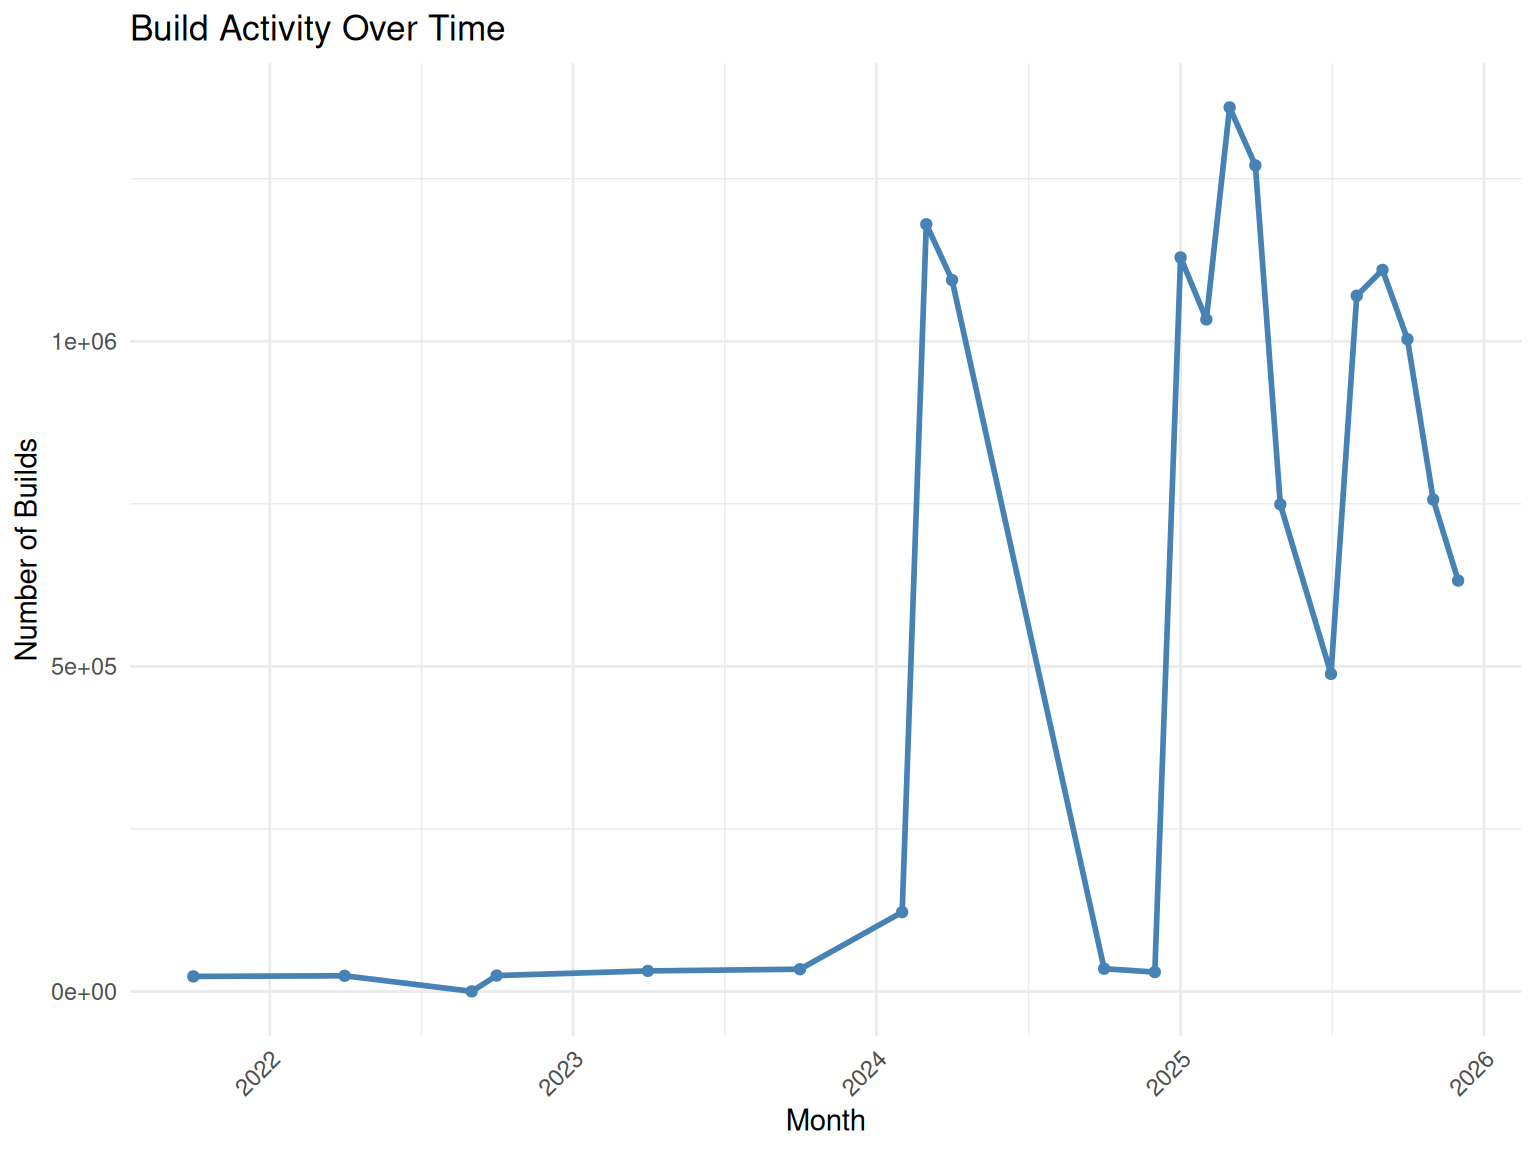
# Error rate over time
monthly_errors <- build_summary |>
  group_by(month) |>
  summarise(
    total = n(),
    errors = sum(status %in% c("ERROR", "TIMEOUT")),
    error_rate = errors / total * 100,
    .groups = "drop"
  ) |>
  mutate(month_date = as.Date(paste0(month, "-01")))

ggplot(monthly_errors, aes(x = month_date, y = error_rate)) +
  geom_line(color = "red", linewidth = 1) +
  geom_point(color = "red") +
  labs(
    title = "Build Error Rate Over Time",
    x = "Month",
    y = "Error Rate (%)"
  ) +
  theme_minimal() +
  theme(axis.text.x = element_text(angle = 45, hjust = 1))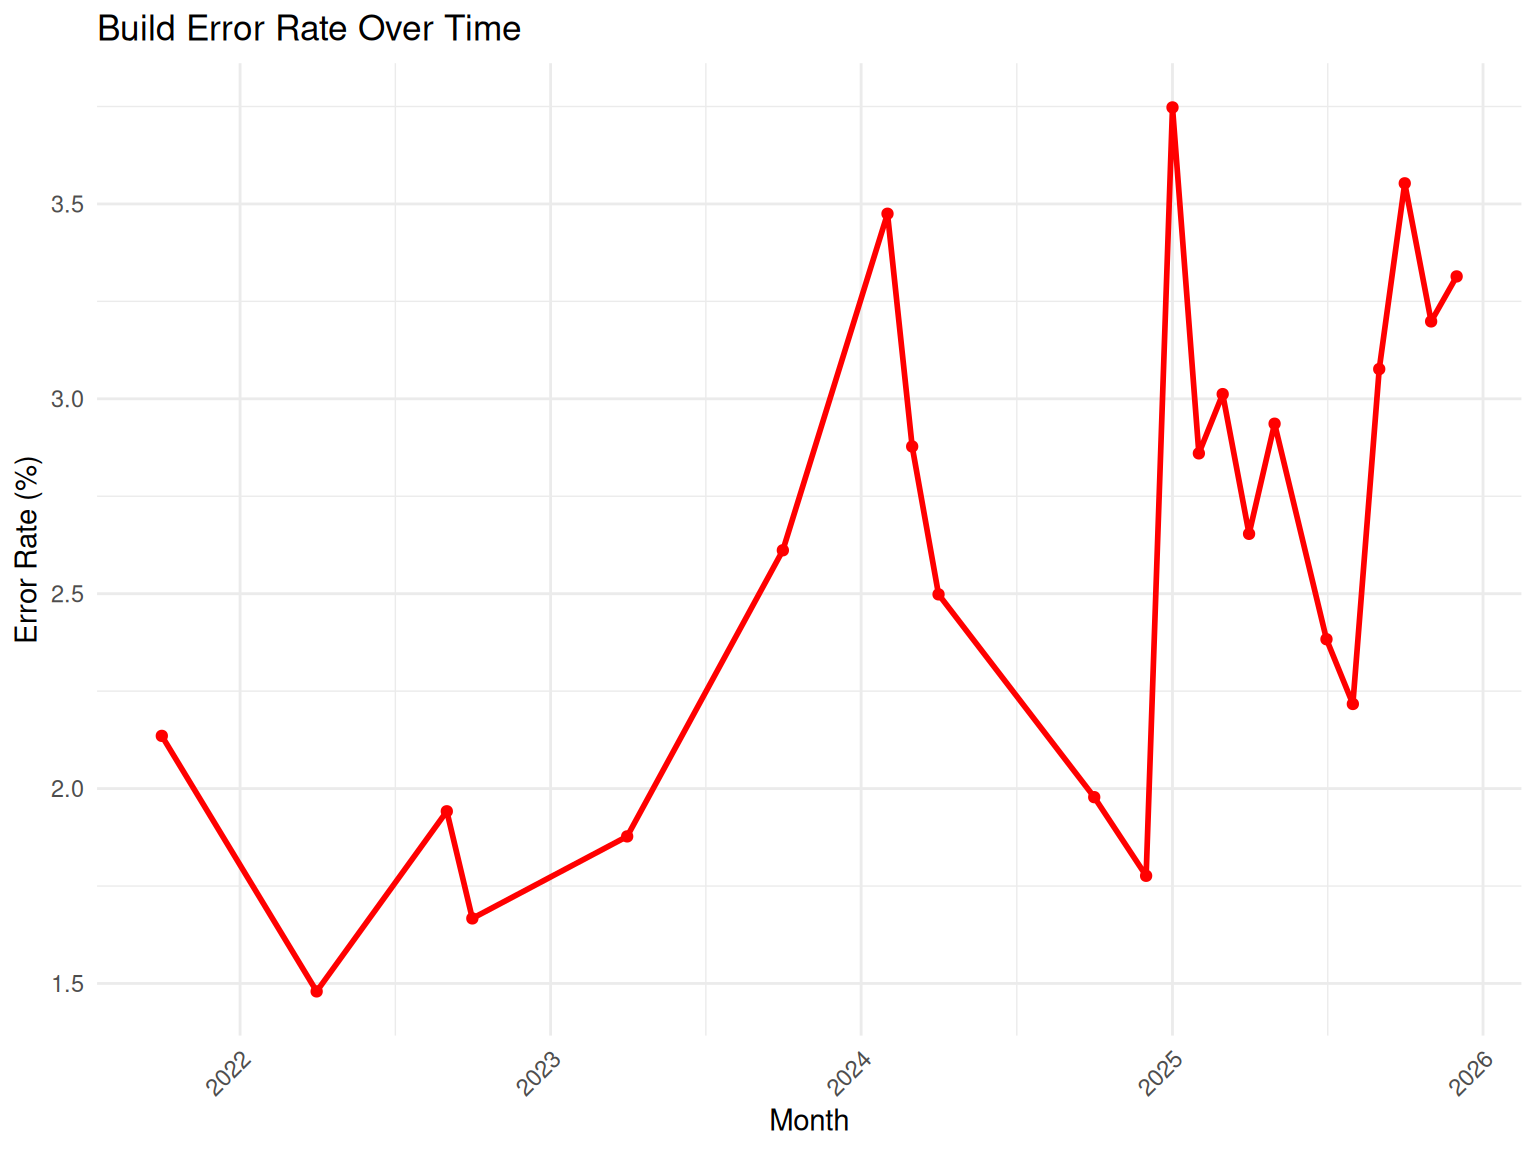
Conclusion
The BiocBuildDB package provides powerful tools for analyzing Bioconductor build system data. This vignette demonstrated:
-
Data Access: Using
get_bbs_table()andget_all_bbs_tables()to retrieve build data -
Package-Specific Queries: Using
get_package_release_info()andpackage_error_count()to analyze individual packages - Exploratory Analysis: Examining package growth, build statuses, platform differences, and temporal patterns
This dataset can help package developers, maintainers, and the Bioconductor community to:
- Monitor package build health
- Identify platform-specific issues
- Track package evolution over time
- Understand common failure patterns
- Improve package quality and reliability
For more information about specific functions, see their documentation with ?function_name.