Colorado shape files from census bureau
zipcode_shapes.RdThis function simply wraps tigris::zctas() to grab the zip code shape
files for later plotting.
zipcode_shapes(
  state = "colorado",
  year = 2010,
  ...,
  progress_bar = interactive()
)
Arguments
| state | character(1) default 'colorado', passed directly to |
|---|---|
| year | integer(1) default 2010, passed directly to |
| ... | passed directly to |
Geographic level
zipcode
See also
Other Data resources:
cdc_places(),
cdc_social_vulnerability_index(),
cell_line_ancestry(),
census_tract_zip_crosswalk(),
rural_zips()
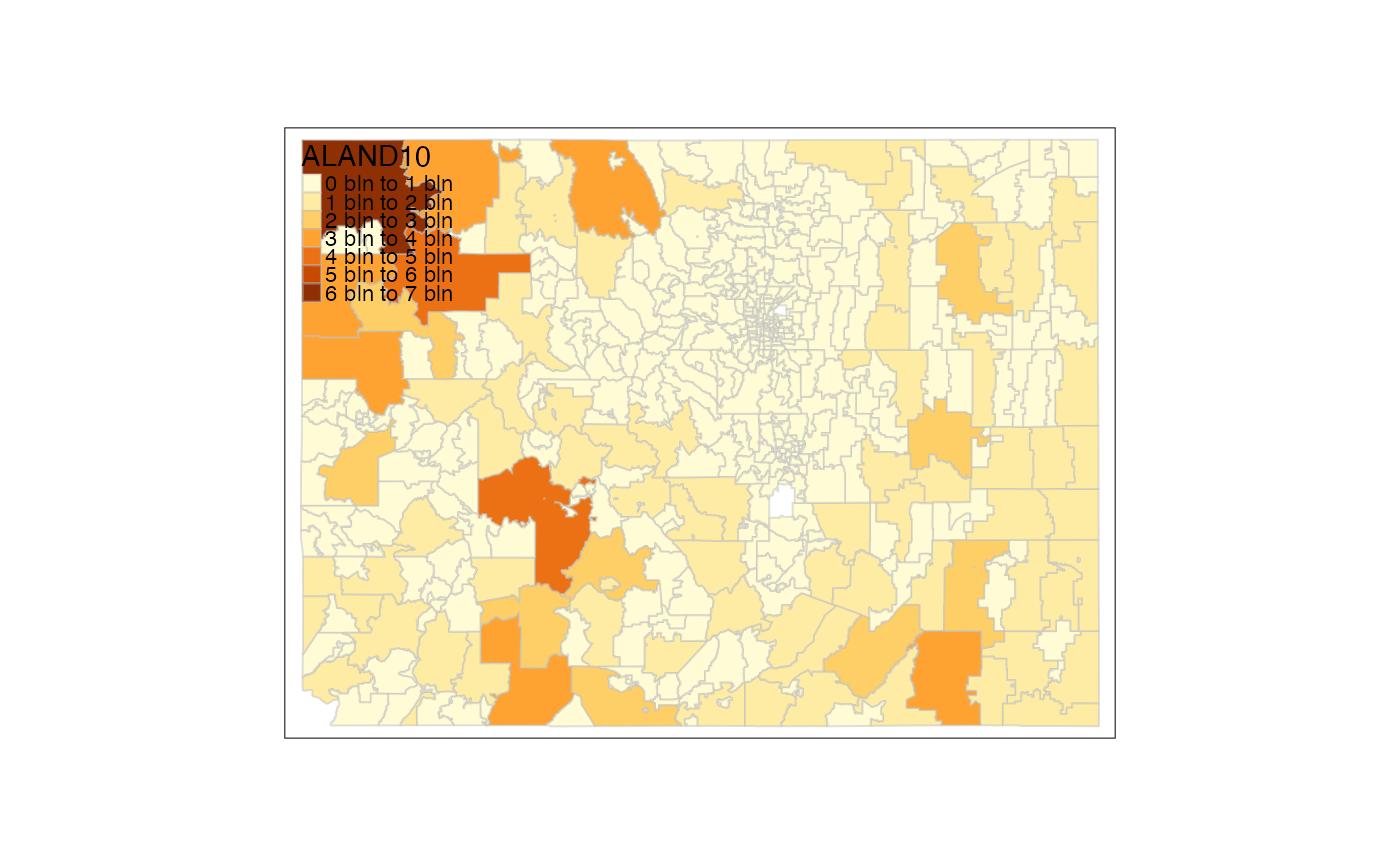
Examples
zipshapes = zipcode_shapes()#>#>tmap::tm_shape(zipshapes) + tmap::tm_fill('ALAND10') + tmap::tm_borders(col="gray",alpha=0.5) + tmap::tm_basemap("Esri.WorldStreetMap")