Methods for dealing with control data for Illumina methylation data
Source:R/MethyLumiSet-class.R
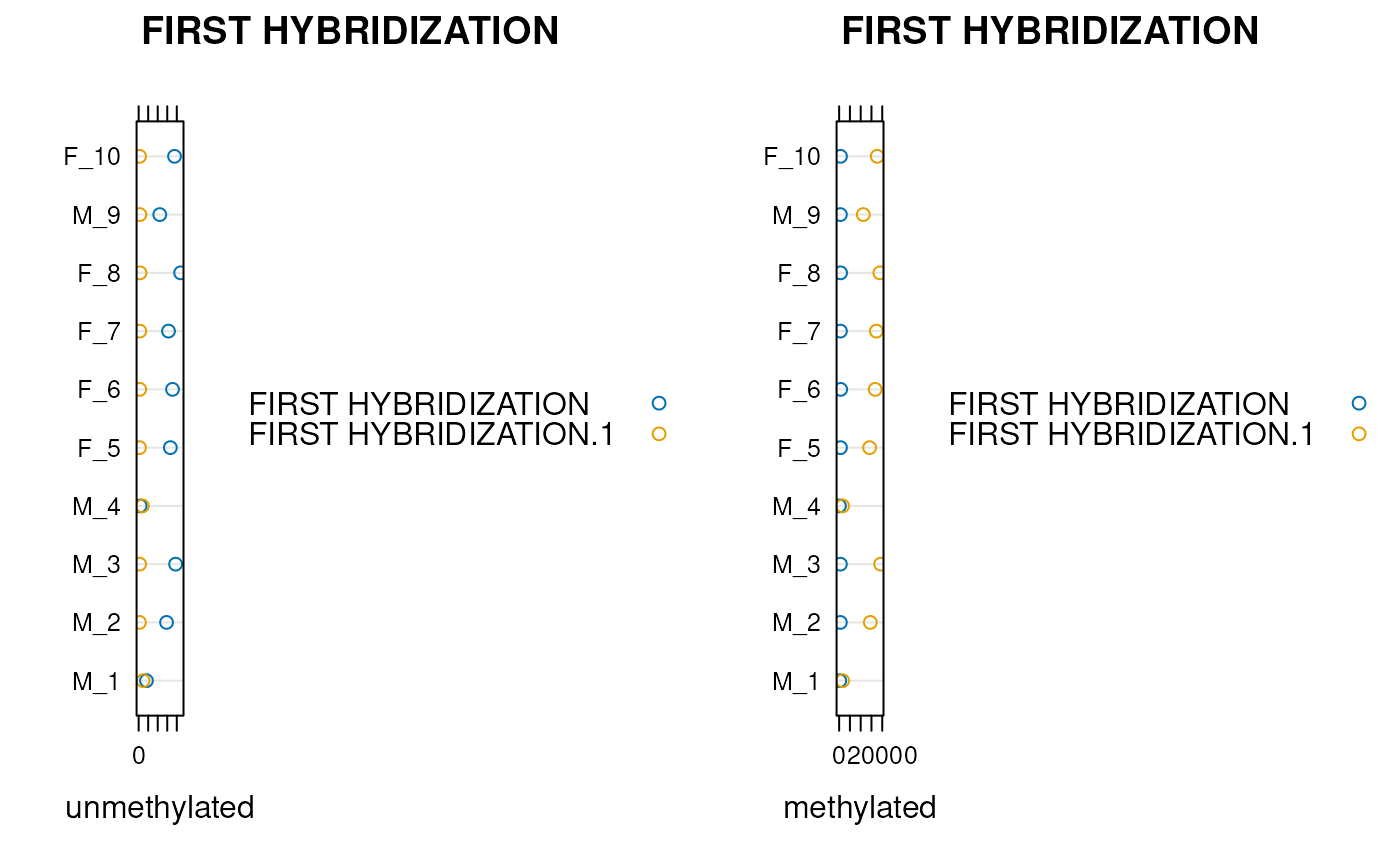
qcplot.RdThe `qcplot` function simply generates a plot of the control probe information for a given `controlType`.
Details
The descriptions of the various control types can be obtained from the Illumina methylation user's guides.
Examples
data(mldat)
controlTypes(mldat)
#> [1] "ALLELE SPECIFIC EXTENSION" "EXTENSION GAP"
#> [3] "FIRST HYBRIDIZATION"       "GENDER"
#> [5] "NEGATIVE"                  "PCR CONTAMINATION"
#> [7] "SECOND HYBRIDIZATION"
qcplot(mldat, controlTypes(mldat)[3])