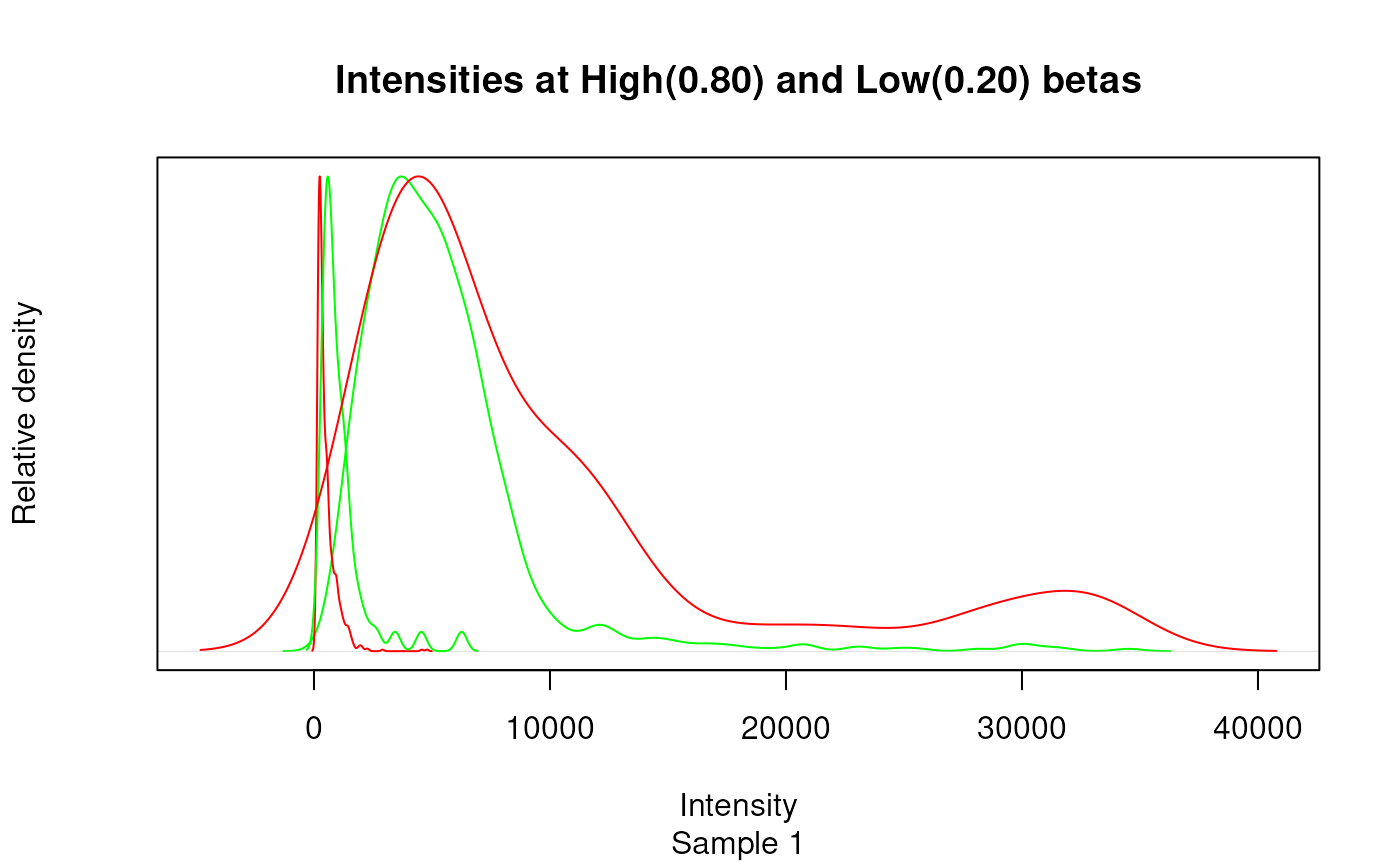
The Illumina methylation platforms all show a significant dye bias. The `plotSampleIntensities` method shows the density plots for the two channels, allowing direct visualization of the effect.
Examples
data(mldat)
plotSampleIntensities(mldat, s = 1)
#> The purpose of this method is better served by diagnostics()