Load histone mark features, predictors
get_features.RdThis is a helper function that simply loads the the histone marks, one row per gene. Marks are given as column names. Row names are some strange mix of Ensembl IDs and junk.
get_features()
Value
a data.frame with histone marks in columns and one row per gene. Gene names are row names.
References
http://starbuck1.s3.amazonaws.com/expression-prediction/features.txt
Examples
feat = get_features()
head(feat)#>                               Control      Dnase     H2az   H3k27ac H3k27me3
#> ENSG00000000419.7.49575069  1.4889005  5.3014825 5.091915 5.9002487 1.926864
#> ENSG00000000457.8.169863093 2.4988150  5.9743785 3.938031 4.9268680 1.952509
#> ENSG00000000938.7.27961645  0.5709902 -0.3187665 1.623319 0.5011164 2.398604
#> ENSG00000001460.12.24740230 1.8854298  7.3455456 4.549188 5.2283188 2.345497
#> ENSG00000001461.11.24742304 1.3106251  7.3984600 5.530642 5.0248829 2.013595
#> ENSG00000001497.11.64754655 1.4852619  6.0811868 4.578087 5.1309106 1.827194
#>                              H3k36me3   H3k4me1  H3k4me2  H3k4me3   H3k79me2
#> ENSG00000000419.7.49575069  2.3510805 2.0440715 6.279558 5.770302  6.1590053
#> ENSG00000000457.8.169863093 2.0373866 3.3312018 5.320028 5.086961  4.4130180
#> ENSG00000000938.7.27961645  0.3580219 0.4790004 3.911917 3.184466 -0.8839223
#> ENSG00000001460.12.24740230 0.9295959 4.3682353 5.897041 5.730867  3.6809648
#> ENSG00000001461.11.24742304 1.9512642 4.4400132 6.577121 5.813670  4.6438269
#> ENSG00000001497.11.64754655 1.9878892 2.2879680 5.727750 5.253145  5.7361040
#>                               H3k9ac   H3k9me1    H3k9me3   H4k20me1
#> ENSG00000000419.7.49575069  6.357470 0.8831567  1.2274619  2.9610552
#> ENSG00000000457.8.169863093 4.949883 1.0052250  1.0225077  0.8776918
#> ENSG00000000938.7.27961645  1.605415 1.1677089 -1.8420669 -0.6247215
#> ENSG00000001460.12.24740230 5.433512 1.2314180  0.9511901  0.4249051
#> ENSG00000001461.11.24742304 5.039812 1.3268172  1.2010861  2.1552969
#> ENSG00000001497.11.64754655 5.769157 0.7417616  0.7007832  2.3329780# Do some multidimensional scaling
mds = cmdscale(dist(t(as.matrix(feat))))
plot(mds, type='n')text(mds, labels=rownames(mds))# limit to top 500 most variable "genes"
sds = apply(feat, 1, sd)
feat_500 = feat[order(sds, decreasing=TRUE)[1:500], ]
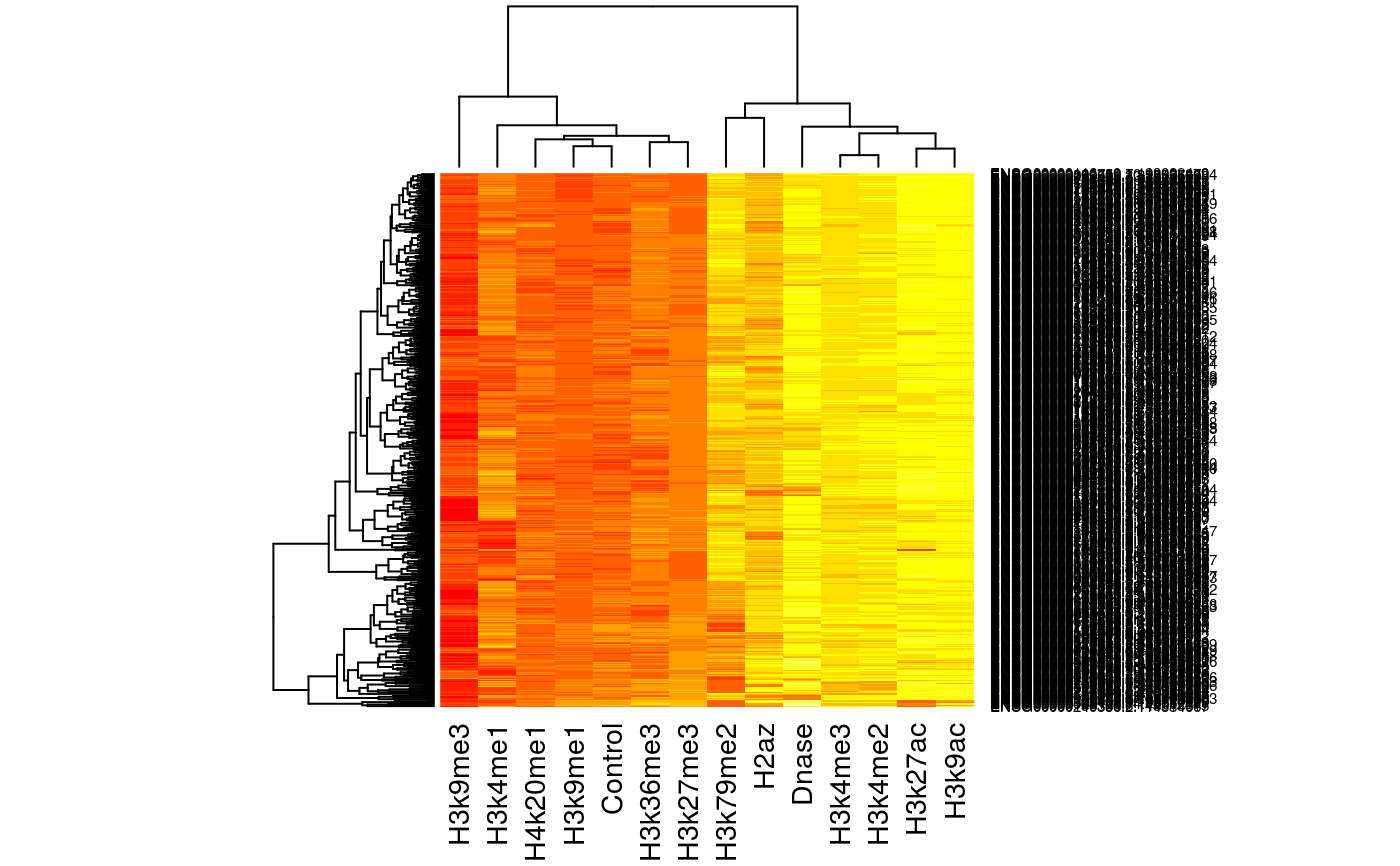
heatmap(as.matrix(feat_500))

