Vector Exercises
Exercises
- Create a numeric vector that starts at 1 and goes to 10 and assign it to the variable v10.
v10 = 1:10
length(v10)- Read the help for the
rnormfunction. What does this function do? Use thernormfunction to sample 100 values from the normal distribution and assign it to the variable my_rn.
my_rn = rnorm(100)
length(rnorm)- What are the mean and standard deviation of
my_rn? Consider using themeanandsdfunctions. Read the help for these functions as well.
mean(my_rn)
sd(my_rn)
# another useful summary
summary(my_rn)- How could you change the mean of
my_rnfrom its current value to its current value + five?
# a couple of options
# Add 5 to every value of my_rn
my_rn2 = my_rn + 5
mean(my_rn2)- You are all going to present your work during the course. We want to
do this as fairly as possible, so we want to use R to randomly assign an
order to you all. If each of you has a number between 1 and 25, how can
you produce a randomized ordering to see who goes first, second, etc.?
See the
sample()function for some help. Assign the ordering to a variablespeakers.
speakers = sample(1:25, replace = FALSE)
# what happens if you use replace=TRUE, the default?- Create two new vectors,
day1andday2containing the first 13 speakers and the last 12 speakers:
day1 = speakers[1:13]
day2 = speakers[14:25]- Use the
rep()function to create a vector of length 10 with just “A” repeating. Do the same, but with “A” and “B” repeating.
# This will work
rep("A", 10)
# What is wrong with this one?
rep(c("A", "B"), 10)
# And how is this different?
# How would you know that you need to include
#   "each"? Read the help, of course. (or trial and error)
rep(c("A", "B"), each=5)- Referring back to your
my_rnexample, use the<operator to create a vector ofTRUEandFALSEso that you isolate values more than 1 standard deviation below the mean. Finally, use the vector ofTRUE/FALSEto get the actual values frommy_rnthat meet these criteria. This is a multi-step problem, so think about the pieces you need and about how to put them together.
# first determine the mean
mean(my_rn)
# then, find the sd
sd(my_rn)
# What is one sd below the mean?
mean(my_rn) - sd(my_rn)
# Assign to a variable
below_mean = mean(my_rn) - sd(my_rn)
# Do the comparison
my_rn < below_mean
# We can even capture to a variable
below_mean_index = my_rn < below_mean
# Finally, we can check our answer
my_rn[below_mean_index]- Make a histogram of your
my_rnvector (seehist). Add a vertical red line to the plot at 1 sd above and below the mean (seehelp('abline')and a green line at the mean.
hist(my_rn)
abline(v = mean(my_rn) - sd(my_rn), col = 'red')
abline(v = mean(my_rn) + sd(my_rn), col = 'red')
abline(v = mean(my_rn), col = 'green')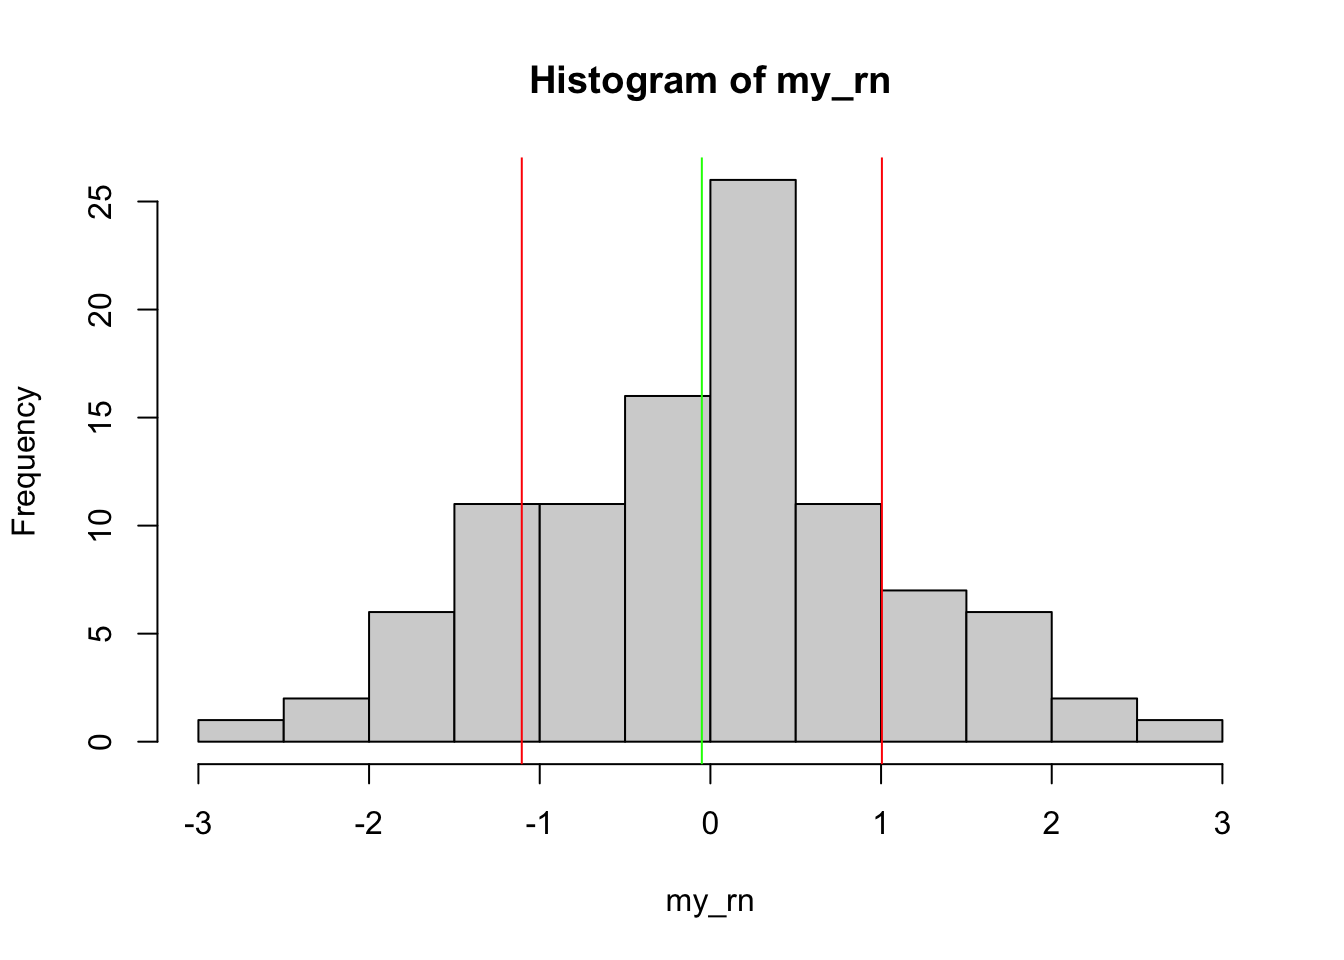
Further examples
If you would like further examples and interactive exercises, try the free DataCamp vector exercises.